|
|
CUMULATIVE STATISTIC PLOTName:
The <stat> CUMULATIVE STATISTIC PLOT is a variant of the <stat> STATISTIC PLOT. There are two cases.
<SUBSET/EXCEPT/FOR qualification> where <stat> is one of Dataplot's supported statistics; <y1> ... <yk> is a list of 1 to 3 response variables (<stat> determines how many response variables); and where the <SUBSET/EXCEPT/FOR qualification> is optional. For a list of supported statistics, enter
This syntax is for the case without groups in the data.
<SUBSET/EXCEPT/FOR qualification> where <stat> is one of Dataplot's supported statistics; <y1> ... <yk> is a list of 1 to 3 response variables (<stat> determines how many response variables); <x> is a group-id variable; and where the <SUBSET/EXCEPT/FOR qualification> is optional. For a list of supported statistics, enter
This syntax is used for the case where there is a group-id variable.
MEAN CUMULATIVE STATISTIC PLOT Y X MEAN CUMULATIVE STATISTIC PLOT Y X SUBSET X > 2 SD CUMULATIVE STATISTIC PLOT Y CORRELATION CUMULATIVE STATISTIC PLOT Y1 Y2
where <value> indicates the minimum number of points before the statistic is computed. Note that if this value is greater than one, then the x-coordinate of the first point will be <value> (rounded to the nearest integer), not one.
The list of supported statistics is frequently updated. Enter HELP STATISTICS for a current list of supported statistics.
. Step 1: Read the data
.
dimension 40 columns
skip 25
read zarr13.dat y1
read berger1.dat y2 x2
read gear.dat y4 x4
skip 0
.
. Step 2: Set some default plot control options
.
case asis
label case asis
tic mark label case asis
title case asis
title offset 2
y1label displacement 15
x1label displacement 12
multiplot scale factor 2
multiplot corner coordinates 5 5 95 95
.
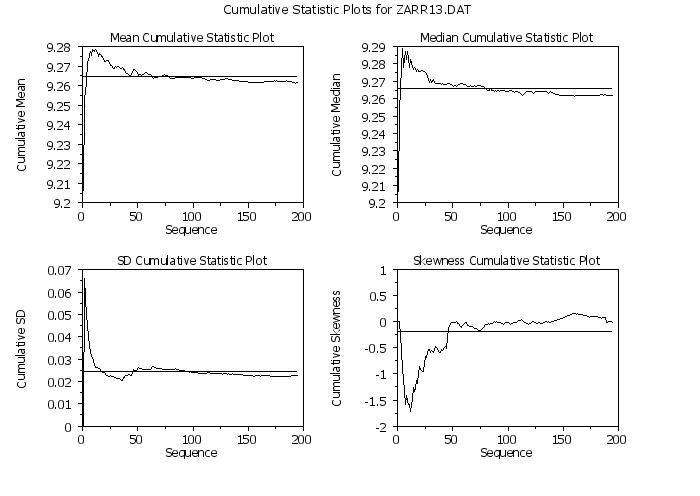
. Step 3: Cumulative plots, no groups, single response variable
.
multiplot 2 2
x1label Sequence
.
title Mean Cumulative Statistic Plot
y1label Cumulative Mean
mean cumulative statistic plot y1
.
title Median Cumulative Statistic Plot
y1label Cumulative Median
median cumulative statistic plot y1
.
multiplot 2 2 3
title SD Cumulative Statistic Plot
y1label Cumulative SD
standard deviation cumulative statistic plot y1
.
title Skewness Cumulative Statistic Plot
y1label Cumulative Skewness
skewness cumulative statistic plot y1
.
end of multiplot
.
just center
move 50 97
text Cumulative Statistic Plots for ZARR13.DAT
.
y1label displacement
x1label displacement
.
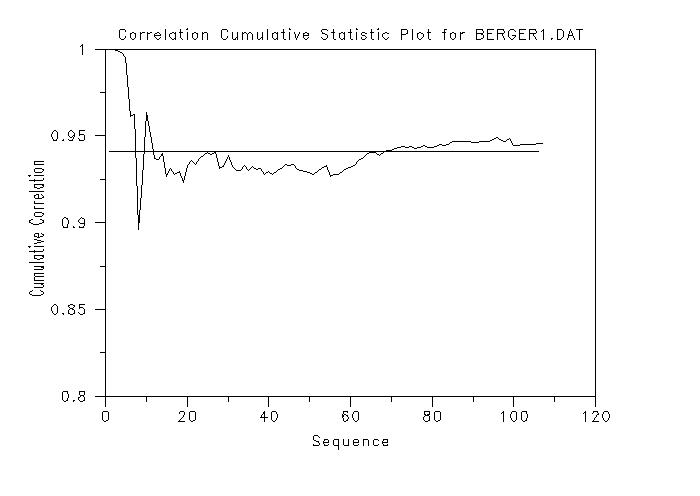
. Step 4: Cumulative/moving plots, no groups, two response variable
.
xlimits 0 120
.
title Correlation Cumulative Statistic Plot for BERGER1.DAT
y1label Cumulative Correlation
correlation cumulative statistic plot y2 x2
.
xlimits
.
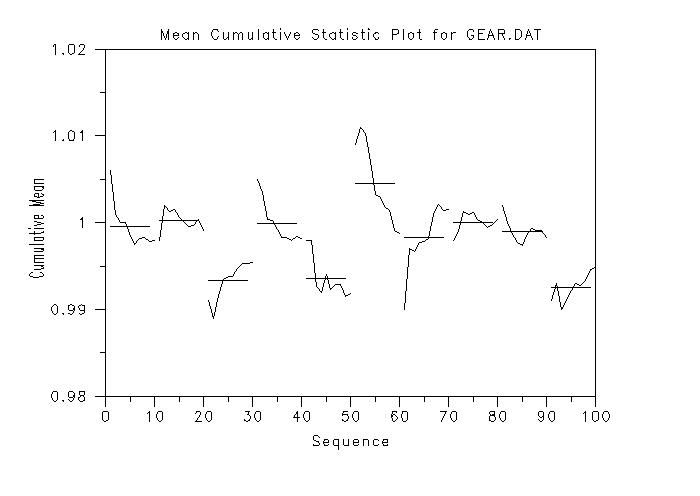
. Step 5: Cumulative plots, groups, one response variable
.
title Mean Cumulative Statistic Plot for GEAR.DAT
y1label Cumulative Mean
mean cumulative statistic plot y4 x4
Date created: 05/29/2015 |
Last updated: 12/04/2023 Please email comments on this WWW page to [email protected]. | ||||||||||||||