
|
|
STATISTIC BLOCKName:
LET A = STANDARD DEVIATION Y LET A = CORRELATION Y1 Y2 See the Supported Statistics page for a list of commands which can use built-in statistics. Although Dataplot provides a large number of built-in statistics, there may be situations where you would like to define a statistic not already supported by Dataplot. Statistic blocks were introduced to address this limitation. Statistic blocks allow you to define statistics using various Dataplot LET subcommands. Statistic blocks are created using the CAPTURE syntax. For example,
LET N = SIZE Y LET YSUM = SUM Y LET A = YSUM/N END OF CAPTURE The statistic block contains the following components
The following Dataplot commands can be included in a statistic block:
The arithmetic operations and statistics LET sub-commands are of particular interest. Commands that are not supported are not added to the statistic block during the CAPTURE operation. Up to 30 commands can be saved to a given statistic block.
where <one/two/three> specifies which statistic block is being created; <name> is the name of the statistic block; <resp> is the name of parameter that is the result of the statistic block; and where <variable list> is a list of 1 to 3 variable names that are used to compute the statistic. This syntax is used to create the contents of a statistic block.
where <one/two/three> specifies which statistic block is being listed. This syntax is used to list the contents of a statistic block.
let n = size y let ysum = sum y let ymean = ysum/n let y2 = (y - ymean)**2 let y2sum = sum y2 let a = sqrt(y2sum/(n-1)) end of capture
This is demonstrated in the Program 2 example below.
skip 25
read gear.dat y x
skip 0
.
. Step 2:   Define the statistic block
.
capture statistic block one zzzzsd a y
let n = size y
let ysum = sum y
let ymean = ysum/n
let y2 = (y - ymean)**2
let y2sum = sum y2
let a = sqrt(y2sum/(n-1))
end of capture
.
xlimits 1 10
major xtic mark number 10
x1tic mark offset 0.5 0.5
x1label Batch
y1label SD of Batch
line blank
char X
.
multiplot corner coordinates 2 2 98 98
multiplot scale factor 2
multiplot 2 1
title automatic
.
zzzzsd plot y x
sd     plot y x
.
end of multiplot
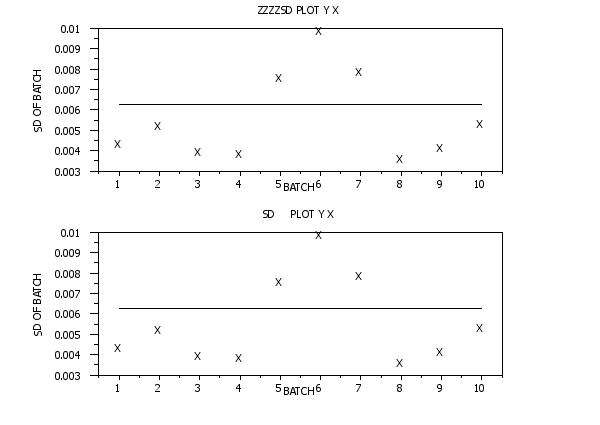 Program 2:
. Step 1:   Read the data
.
skip 25
read gear.dat y x
skip 0
.
. Step 2:   Create and compile the Fortran code
.
capture script exec.for
      program test
c
c     For this simple example, read in a data set and
c     compute the mean and standard deviation.
c
      real x(10000)
c
      xmean=0.0
      xsd=0.0
      nval=0
      read(*,*,end=19,err=9020)nval
c
      sum1=0.0
      do 10 i=1,min(nval,10000)
         read(*,*,end=19,err=9020)x(i)
         sum1=sum1 + x(i)
   10 continue
   19 continue
      if(nval.ge.1)then
        xmean=sum1/real(nval)
      endif
c
      if(nval.gt.1)then
        sum1=0.0
        do 20 i=1,nval
           sum1=sum1 + (x(i)-xmean)**2
  20    continue
        xsd=sqrt(sum1/real(nval-1))
      endif
c
c     Now write sd to standard output
c
 9020 continue
      write(*,*)xsd
c
      stop
      end
end of capture
.
system gfortran -o exec.exe  exec.for
.
. Step 3:   Define the statistic block
.
capture statistic block one zzzzsd a y
let ztemp = execute ./exec.exe y
let a = ztemp(1)
end of capture
.
xlimits 1 10
major xtic mark number 10
x1tic mark offset 0.5 0.5
x1label Batch
y1label SD of Batch
line blank
char X
.
multiplot corner coordinates 2 2 98 98
multiplot scale factor 2
multiplot 2 1
title automatic
.
zzzzsd plot y x
sd     plot y x
.
end of multiplot

Date created: 09/23/2016 |
Last updated: 12/11/2023 Please email comments on this WWW page to [email protected]. | |||||||||||||||||||