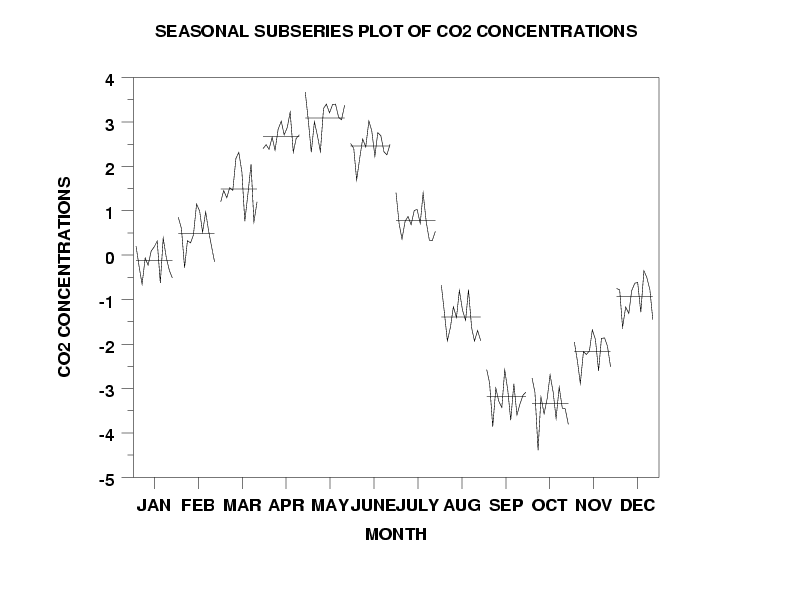
SED navigation bar go to SED home page go to Dataplot home page go to NIST home page SED Home Page SED Staff SED Projects SED Products and Publications Search SED Pages
Dataplot Vol 1 Vol 2

SEASONAL SUBSERIES PLOT

Name:
    SEASONAL SUBSERIES PLOT
Type:
    Graphics Command
Purpose:
    Generates a seasonal subseries plot.
Description:
    A seasonal subseries plot is used to determine if there is significant seasonality in a time series. Instead of a straight time order plot, it splits the plot into the corresponding seasons (or periods). For example, for monthly data, all the January values are plotted, then all the February values, and so on. Reference lines are drawn at the seasonal means.
Syntax:
    LET PERIOD = <value>
    LET START = <value>

    SEASONAL SUBSERIES PLOT <y>
                            <SUBSET/EXCEPT/FOR qualification>
    where <y> is the response variable;
    and where the <SUBSET/EXCEPT/FOR qualification> is optional.

    The LET command is uses to define the period (e.g., the period for monthly data is typically 12) and the start value. The start value is used when the data do not start in the first unit of the period (e.g., if you have monthly data that starts in March instead of January, you would use LET START = 3).

Examples:
    LET PERIOD = 12
    LET START = 3
    SEASONAL SUBSERIES PLOT Y

    LET PERIOD = 4
    LET START = 1
    SEASONAL SUBSERIES PLOT Y

Note:
    The sample program below shows how to use various plot control commands to label the plot.
Default:
    None
Synonyms:
    None
Related Commands: Reference:
    Cleveland, William S. (1993), "Visualizing Data", Hobart Press,
Applications:
    Time Series Analysis
Implementation Date:
    2000/1
Program:
    skip 25
    read mlco2mon.dat co2 date year month
    .
    . Linear Fit to Detrend Data
    .
    fit co2 date
    let co2res = res
    .
    . Seasonal Subseries Plot
    .
    xlimits 7 167
    xtic offset 7 7
    major xtic mark number 12
    minor xtic mark number 0
    x1tic mark label format alpha
    x1tic mark label content Jan Feb Mar Apr May June July Aug Sep ...
    Oct Nov Dec
    x1label Month
    y1label CO2 Concentrations
    let period = 12
    let start = 5
    title Seasonal Subseries Plot of CO2 Concentrations
    seasonal subseries plot co2res

    plot generated by sample program

Date created: 06/05/2001
Last updated: 12/04/2023

Please email comments on this WWW page to alan.heckert@nist.gov.