
|
ORD PLOTName:
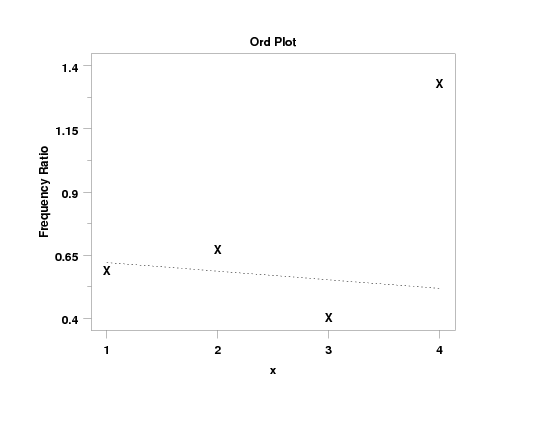
If x and nx denote the class value and the corresponding class frequency, then the Ord plot is a plot of
If this plot is approximately linear, then it can help distinguish between these four distributions based on the following table:
The slope and intercept can be determined by fitting a line to the plotted points. We follow the suggestion of Friendly of using the weights
This compensates for the fact that classes with small frequency have large variance. The primary disadvantage of this plot is that a discrepant frequency affects the points for both x and x+1. For this reason, the Ord plot does not have good resistance properties.
where <y> is a response variable; and where the <SUBSET/EXCEPT/FOR qualification> is optional. This syntax is used for the case where you have raw data. Dataplot will automatically create the frequency table.
where <y> is a variable containing frequencies; <x> is a variable containing the class value; and where the <SUBSET/EXCEPT/FOR qualification> is optional. This syntax is used for the case where your data is already in the form of a frequency table.
ORD PLOT Y X
PPA1 - the slope of the fitted line
. Data from p. 47 of Friendly
read x y
0  109
1   65
2   22
3    3
4    1
end of data
.
title case asis
title offset 2
label case asis
title Ord Plot
y1label Frequency Ratio
x1label x
.
tic offset units screen
tic offset 3 3
xlimits 1 4
major xtic mark number 4
minor xtic mark number 0
.
character x blank
line blank dotted
.
ord plot y x

Date created: 07/25/2007 |
Last updated: 12/04/2023 Please email comments on this WWW page to [email protected]. | ||||||||||||||||||||||||||||||||||||||||||||