
|
|
NORMAL PLOTName:
The characteristics of these components are controlled through the LINE and CHARACTER commands. If you have groups in the data, you can specify a "highlight" option to draw the points in the different groups with different attributes. For example, this can be used to draw outliers in a different color.
where <y> is a response variable; and where the <SUBSET/EXCEPT/FOR qualification> is optional.
where <y> is a response variable; <tag> is a censoring variable (values equal to 0 are omitted from the plot); and where the <SUBSET/EXCEPT/FOR qualification> is optional.
<SUBSET/EXCEPT/FOR qualification> where <y> is a response variable; <x> is a group-id variable; and where the <SUBSET/EXCEPT/FOR qualification> is optional.
<SUBSET/EXCEPT/FOR qualification> where <y> is a response variable; <x> is a group-id variable; <tag> is a censoring variable (values equal to 0 are omitted from the plot); and where the <SUBSET/EXCEPT/FOR qualification> is optional.
NORMAL PLOT Y1 CENSOR HIGHLIGHT NORMAL PLOT Y1 X
To reset the default, enter
2011/02: Added support for HIGHLIGHT option 2014/07: Added the SET NORMAL PLOT AXES option
SKIP 25
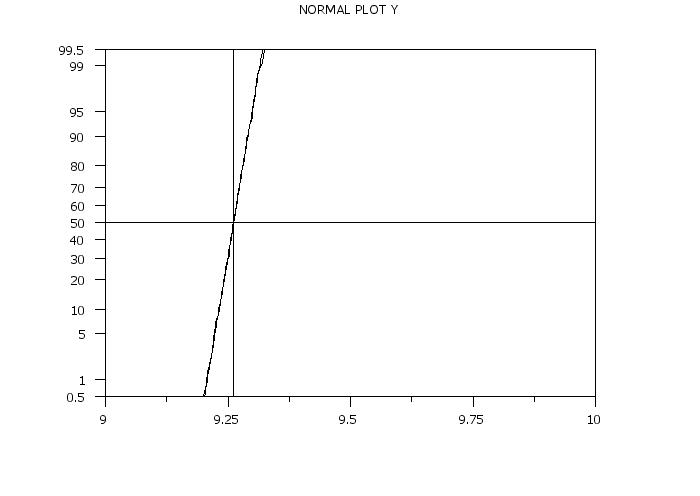
READ ZARR13.DAT Y
LINE SOLID DASH DOT DOT
TITLE AUTOMATIC
NORMAL PLOT Y
Date created: 01/31/2015 |
Last updated: 12/04/2023 Please email comments on this WWW page to [email protected]. | |||||||||||||||||||||||||||||||||||||||||||||||||||||||||||||||||||||||||