
|
IMAGE PLOTName:
Dataplot does not currently support an "image" data type. Image plots are generated from columns of data. There are two types of images supported:
Support for image plots is dependent on the capabilities of the given device. Currently, image plots are supported for the following output devices.
<SUBSET/EXCEPT/FOR qualification> where <grey> is a variable that specifies the grey scale values; <rowid> is a variable that specifies the row of the image; <colid> is a variable that specifies the column of the image; and where the <SUBSET/EXCEPT/FOR qualification> is optional.
<SUBSET/EXCEPT/FOR qualification> where <red> is a variable that specifies the values of the red component; <blue> is a variable that specifies the values of the blue component; <green> is a variable that specifies the values of the green component; <rowid> is a variable that specifies the row of the image; <colid> is a variable that specifies the column of the image; and where the <SUBSET/EXCEPT/FOR qualification> is optional.
where <grey> is a matrix that specifies the grey scale values; and where the <SUBSET/EXCEPT/FOR qualification> is optional.
<SUBSET/EXCEPT/FOR qualification> where <red> is a matrix that specifies the values of the red component; <blue> is a matrix that specifies the values of the blue component; <green> is a matrix that specifies the values of the green component; and where the <SUBSET/EXCEPT/FOR qualification> is optional.
IMAGE PLOT RED BLUE GREEN ROWID COLID
Dataplot takes the absolute value of the numbers. By default, Dataplot assumes a (0,255) range. If the maximum absolute value is greater than 255, then the range is assumed to be 0 to that maximum value. Alternatively, you can specify the maximum value by entering the command
The minimum is always assumed to be 0. When the image is rendered on a specific device, the (0,1) scale is translated to whatever range is supported on the specific device. For the Quickwin, GD, and Postscript devices, this is (0,255) for each of the red-blue-green-greyscale components. For X11, greyscale is converted to a (0,100) scale and full color is not currently supported.
where <n> will be rounded to the nearest integer. So if <n> = 2, each row of the image variables will be drawn as a 2x2 square. Other than this, Dataplot does not expand or contract the image. If the number of rows or columns in the image exceeds the available number of pixels on the device, the extra rows/columns will simply not be plotted. Likewise, the image will not automatically be explanded to fill a pre-specified size. The one exception to this is the Postscript device. More is said about this in the note below.
The Postscript device uses image operators that are supported in Postscript. This means that Postscript may perform some scaling/smoothong of the image.
These values are in 0 to 100 units and default to 15, 20, 85, and 90, respectively. To use the full area of the device, enter
Titles, tic marks, tic mark labels, and axis labels are controlled with the usual commands.
Once you read an image into Dataplot (into columns of data), you can perform many desired image manipulation functions (e.g., rotation, cropping) using the LET command. Alternatively, you can use freely downloadable image manipulation software such as Image Magick or NetPBM to perform basic image manipulation functions. If this software is installed on your system, you can use the Dataplot SYSTEM command to invoke this software from within Dataplot.
.  Step 1: Define output device
set postscript ppi 100
set ipl1na elliott.ps
device 2 postscript
.  Step 2: Read image
dimensions 10 columns
skip 25
set read format 3f7.0
read elliottr.dat y row col
skip 0
set read format
.
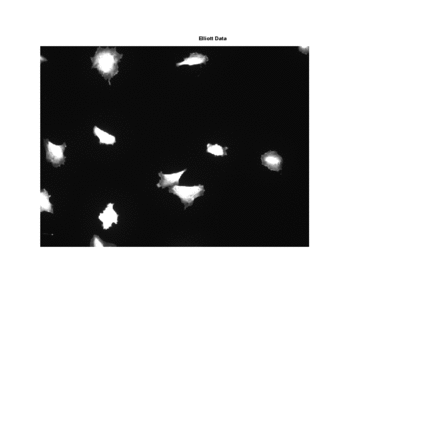
title Elliott Data
title case asis
title offset 2
.  Step 3: Generate the image
frame corner coordinates 2 2 98 95
frame off
character size 1
image plot y row col
.
device 2 close

Date created: 01/06/2009 |
Last updated: 12/04/2023 Please email comments on this WWW page to [email protected]. | ||||||||||||||