GD
Name:
Type:
Purpose:
Create PNG, JPEG, GIF, BMP and TIFF format graphics files.
Description:
PNG, JPEG and GIF format graphics files are useful for web
applications since most web browsers provide native support
for these formats (i.e., the graphs can be viewed using the
an ![]() tag without the use of a plug-in). These formats
can also be useful for importing graphs into word processing
and presentation programs since many of these program can
import these type of files directly. In addition, if you
need a graphic in a specific image format, many image
conversion programs can convert these formats into a wide
variety of other image formats. Several additional formats are
supported (see Note section below), but PNG, JPEG and GIF are the
most commonly used. tag without the use of a plug-in). These formats
can also be useful for importing graphs into word processing
and presentation programs since many of these program can
import these type of files directly. In addition, if you
need a graphic in a specific image format, many image
conversion programs can convert these formats into a wide
variety of other image formats. Several additional formats are
supported (see Note section below), but PNG, JPEG and GIF are the
most commonly used.
Dataplot implements these formats using the GD library. The GD
library was originally developed by Thomas Boutell. It is now
maintained and developed as an open source library. The web
page for GD is located at
and the source code can be downloaded at
The GD library is used by the popular PHP, Perl and Ruby software
programs (as well as other programs), so it will be available on
most Linux/Unix platforms. If it is not already installed, there
are packages for the most common Linux/Unix distros.
Dataplot is not particularly sensitive to which version
of the GD library you have on your system. Any reasonably
current version should suffice. The major restriction is
that GD 1.x versions are no longer supported (GD changed
some calling sequences in moving to the 2.x versions). The
Dataplot code is now updated to use the 2.x calling
sequence This change was made in the 03/2006 version of
Dataplot.
Syntax:
DEVICE <1/2/3> GD <format>
where <format> is one of PNG, JPEG, GIF, BMP, WBMP, TIFF, TARGA,
or WEBP.
This form designates one of DATAPLOT's 3 devices as an GD device.
For the GD device, DEVICE 2 is typically used.
Examples:
DEVICE 2 GD PNG
DEVICE 2 GD JPEG
DEVICE 2 GD GIF
Note:
DATAPLOT must be linked with the proper GD libraries in order for
the GD driver to work. If this is not the case, contact your
local DATAPLOT installer.
Note:
Dataplot upgraded to the 2.1 version of GD July, 2014. With this
upgrade, Dataplot now supports several additional image formats.
- added support for the BMP format. This device was available
in previous versions of GD, but I had not activated it for
Dataplot. BMP is a common format in the Windows environment.
- added support for the WBPM format. This device was available
in previous versions of GD, but I had not activated it for
Dataplot. WBMP is a black and white format that was originally
intended for mobile/wireless applications. It is not commonly
used anymore.
- added support for TGA (Targa format). Note that this format
is coded but has not been tested.
- added support for TIFF. Note that this option requires that
the "libtiff" library be installed, so this format may not be
available in some Dataplot installations.
- the webp format is supported if the VPX library is available.
This is a relatively new format championed by Google. It is
primarily intended for viewing videos on the web. This format
will probably not be available on most Dataplot installations.
Version 2.3.2 added support for the AVIF and HEIF formats. We have
not yet updated Dataplot to support these formats.
Be aware that some of these formats require external libraries
that may not be available with the version of the GD library
installed on your local platform.
The basic GD implementation uses the libraries: zlib, libpng,
libjpeg, and libfreetype. These should be included with most GD
installations. The libtiff library is typically available on most
Linux platforms. However, the libraries for the webp, AVIF and HEIF
formats are less likely to be available.
Note:
There are several alternative methods for generating PNG/JPEG/GIF
files with Dataplot. For example,
- Dataplot can generate Postscript (PDF files can be generated
using Ghostscript) and Scalable Vector Graphics (SVG) graphics
files. Using the open source GIMP software, the Postscript or
SVG file can be converted to a number of different common image
formats. The advantage of this method is that it maintains the
high quality of the original Postscript/SVG file (GIMP uses
anti-aliasing when converting from a vector format to a
bit map format). The disadvantage is that it requires an
additional manual step.
There are other software programs that can convert
Postscript/SVG to bit map formats. However, not all of these
programs perform anti-aliasing, so the quality may vary.
- The Windows version of Ghostview can convert Postscript/PDF
files to JPEG.
- Either Ghostscript or the ImageMagick convert program can be
used to automatically convert Dataplot's Postscript output
to JPEG, TIFF, PDF, PBM, PGM, PPM or PNM. For details, enter
- The Dataplot CAIRO device driver
supports PNG. However this driver is still in "beta" mode.
Note:
Typically, for PNG, JPEG, or GIF output, it is desirable to put
each plot in a separate file with a unique name. This can
be accomplished with a sequence of commands like the following:
SET IPL1NA PLOT1.PNG
DEVICE 2 GD PNG
generate first plot
DEVICE 2 CLOSE
SET IPL1NA PLOT2.PNG
DEVICE 2 GD PNG
generate second plot
DEVICE 2 CLOSE
The SET IPL1NA command specifies the name of the file. Note
that this name is currently converted to upper case.
This command should come before the DEVICE 2 GD command.
Note:
The default image size is 600 pixels by 450 pixels. You
can change the default size of the image by using the
DEVICE ... PICTURE POINTS command. For example,
SET IPL1NA PLOT1.PNG
DEVICE 2 GD PNG
DEVICE 2 PICTURE POINTS 300 300
generate first plot
DEVICE 2 CLOSE
Note:
GD supports hardware text in the following two ways:
- There are 5 built-in fonts: TINY, SMALL, MEDIUM, LARGE,
or GIANT. These will be available for all GD
installations. These are fixed size fonts.
- GD supports the use of True Type fonts using the Free Type
library. If you have True Type fonts (these fonts are
identified with a ".ttf" file extension) installed on your
system, you can specify that Dataplot use these fonts with
the command
Note that you must specify the full path name for the font
name. For example
SET GD FONT /usr/share/fonts/gnu-free/FreeSansBold.ttf
There are several ways to locate or obtain True Type fonts.
- Dataplot provides a limited number of True Type fonts in the
"fonts" directory in the Dataplot auxilary files directory.
On Linux systems, this is often one of
/usr/local/lib/dataplot/fonts
/usr/lib/dataplot/fonts
On Windows platforms, this is
C:\Program Files (x86)\NIST\DATAPLOT\FONTS
- Many platforms will have libraries of True Type fonts
already installed.
For example, on the Red Hat Enterprise version 8 (including
derivative CentOS and Rocky) Linux system, a number of True
Type fonts are availabe in
There are a number of sub-directories under this that
contain the fonts. For example the "gnu-free" sub-directory
contains the following fonts
FreeMonoBoldOblique.ttf
FreeMonoBold.ttf
FreeMonoOblique.ttf
FreeMono.ttf
FreeSansBoldOblique.ttf
FreeSansBold.ttf
FreeSansOblique.ttf
FreeSans.ttf
FreeSerifBoldItalic.ttf
FreeSerifBold.ttf
FreeSerifItalic.ttf
FreeSerif.ttf
These directories contain some fonts with ".ttf" file
name extensions and some with ".otf" file name extensions.
Only the ".ttf" font files should be used with the GD
driver.
Under Windows 10, many fonts are stored in the
directory. True Type fonts are identified with a ".ttf"
file name extension. Note that you free to use these fonts
with Dataplot. However, Microsoft does not grant
re-distribution rights, so none of these are included in the
Dataplot "fonts" directory.
- There are both commercial and freely downloadable True Type
fonts available on the Internet.
Note:
There are two color models supported. The "fixed" mode uses
a color palette with a maximum of 256 colors. The "true" mode
supports RGB mode where each of the three components can be
set from 0 to 255.
To specify the color model, enter
SET GD COLOR <TRUE/FIXED>
The default is FIXED. The TRUE mode is recommended if you are
going to be generating image plots. Otherwise the FIXED option
should be sufficient for most applications.
Note:
Dataplot also uses the GD library to read image data in PNG, JPEG, or
GIF format. Enter HELP READ IMAGE for
details.
Note:
The 2023/10 version of Dataplot corrected a number of issues with
the GD driver.
- Dashed and dotted lines now work.
- Region fills were fixed. Rectangular regions are performed
in hardware (i.e., by the GD library) while non-rectangular
fills are performed in software (i.e., by Dataplot).
The following command was added
SET GD HARDWARE FILL <ON/OFF>
The default is OFF and this is recommended. The ON option is
currently intended for testing purposes and it is recommended
that this option be left as OFF. The ON option specifies
that non-rectangular regions be filled in hardware.
- Fixed the background color when true color mode is specified.
Default:
If no device is specified, the default device is PNG.
Synonyms:
Device Notes:
- HARDWARE TEXT - the GD driver supports 5 built-in fonts. In
addition, True Type fonts are supported if available. The
True Type font can be specified with the
command.
- COLOR - GD supports the full range of 163 colors supported
by Dataplot. Full RGB coor is supported in true color mode.
- HARDWARE FILL - Solid area fills for rectangles are performed in
hardware (i.e., by the GD library) and non-rectangular fills
are performed in software (i.e., by Dataplot).
- DASH PATTERNS - The following dash patterns are available:
- DASH - 3 pixels on, 3 pixels off;
- DOT - 1 pixel on, 1 pixels off;
- DASH2 - 4 pixels on, 2 pixels off
- DASH3 - 3 pixels on, 3 pixels off,
1 pixel on, 1 pixel off;
- DASH4 - 2 pixels on, 2 pixels off.
- DASH5 - 2 pixels on, 1 pixels off,
1 pixel on, 1 pixel off;
- LINE WIDTH - Thick lines are generated in software (i.e.,
by Dataplot).
- GRAPHICS INPUT - The CROSS-HAIR command is not supported
for this device.
- The CHARACTER PIXEL option is supported on this device.
Related Commands:
|
POSTSCRIPT
|
= Direct graphical output to a Postscript device.
|
|
SVG
|
= Generate graphical output in Scalable Vector
Graphics format.
|
|
DEVICE
|
= Specify certain actions for the graphics output.
|
Applications:
Web Applications, Graphics Import Into Other Programs
Implementation Date:
2001/02
2006/02: Upgraded to the 2.x version of the GD library
2008/03: Support for true color mode
2008/03: Support for hardware text
2008/03: Support for reading image files
2014/07: Added support for TIFF, BPM, WBPM, TGA and WEBPP formats
2020/11: Increased number of supported colors in FIXED mode from
89 to 163
2023/10: Fixed dashed/dotted lines
2023/10: Fixed region fill
2023/10: Fixed background color for true color mode
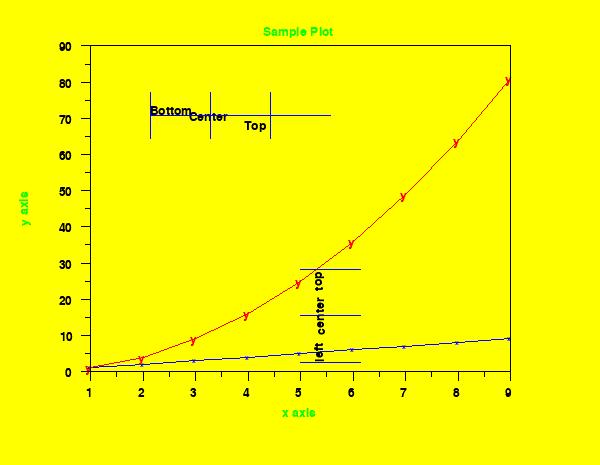
Program 1:
background color yellow
. Following path name is for a Rocky 8 system
set gd font /usr/share/fonts/gnu-free/FreeSansBold.ttf
set ipl1na gd.jpg
device 2 gd jpeg
device 2 font tektronix
.
char hw 1 0.75 2 1.5
char x y
char color blue red
line color blue red
.
title offset 2
title Sample Plot
title case asis
y1label y axis
x1label x axis
label color green
title color green
.
legend 1 direction vertical
legend 1 just lece
legend 1 coordinates 55 22
legend 1 left
legend 2 direction vertical
legend 2 just cece
legend 2 coordinates 55 32
legend 2 center
legend 3 direction vertical
legend 3 just rice
legend 3 coordinates 55 42
legend 3 top
.
plot x    for x = 1 1 9 and
plot x**2 for x = 1 1 9
.
just lebo
move 25 75
text Bottom
just cece
move 35 75
text Center
just rito
move 45 75
text Top
draw 25 75 55 75
draw 25 80 25 70
draw 35 80 35 70
draw 45 80 45 70
.
draw 50 22 60 22
draw 50 32 60 32
draw 50 42 60 42
device 2 close
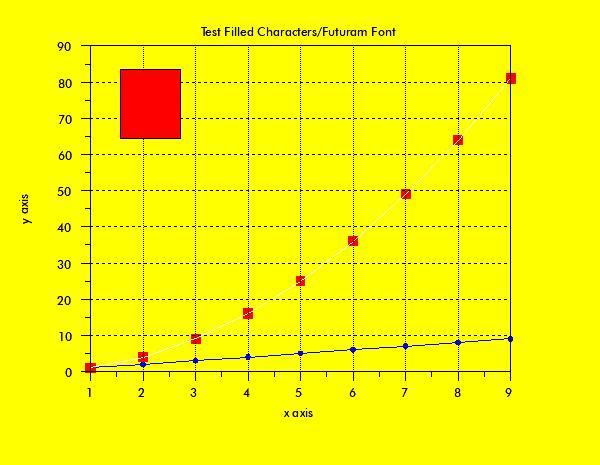
 Program 2:
background color yellow
. Path name for font will be implementation dependent
set gd font /usr/local/lib/dataplot/fonts/futuram.ttf
set ipl1na gd2a.jpg
device 2 gd jpeg
device 2 font tektronix
.
char hw 1 0.75 2 1.5
char circle box
char color blue red
char fill on on
line solid solid
line color blue ivory
.
grid on
xgrid pattern dotted
ygrid pattern dashed
.
title offset 2
title Test Filled Characters/Futuram Font
title case asis
y1label y axis
x1label x axis
.
plot x    for x = 1 1 9 and
plot x**2 for x = 1 1 9
.
box shadow hw 0 0
box fill pattern solid
box fill color red
box 20 70 30 85
grid off
.
device 2 close
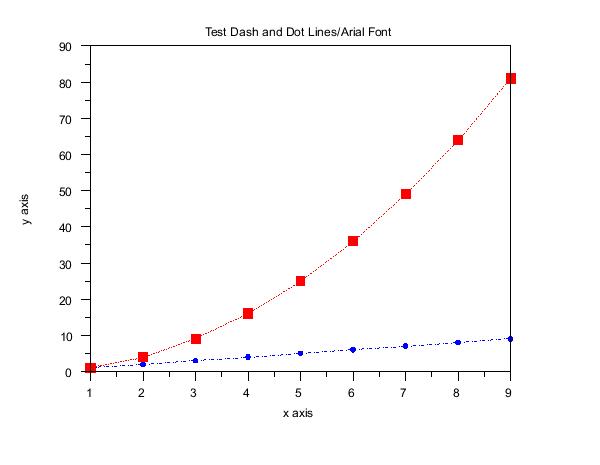
background color white
. Path name for font will be implementation dependent
set gd font /usr/local/lib/dataplot/fonts/arial.ttf
set ipl1na gd2b.jpg
device 2 gd jpeg
device 2 font tektronix
.
line color black black
line da3 da5
.
title offset 2
title Test Dash and Dot Lines/Arial Font
title case asis
y1label y axis
x1label x axis
.
plot x    for x = 1 1 9 and
plot x**2 for x = 1 1 9
.
device 2 close
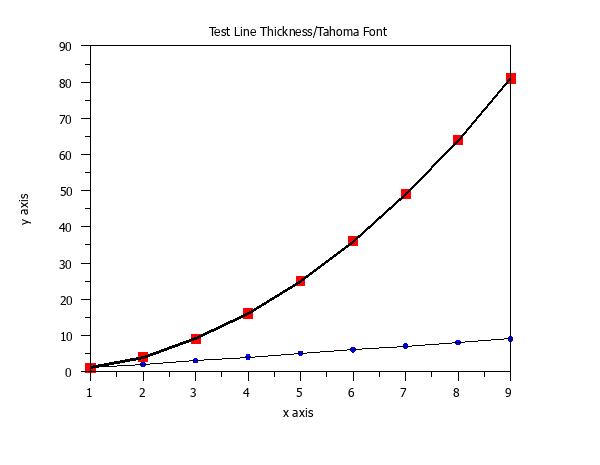
background color white
set ipl1na gd2c.jpg
. Path name for font will be implementation dependent
set gd font /usr/local/lib/dataplot/fonts/Tahoma.ttf
device 2 gd jpeg
device 2 font tektronix
.
line solid solid
line thickness 0.2 0.3
.
title offset 2
title Test Line Thickness/Tahoma Font
title case asis
y1label y axis
x1label x axis
.
plot x    for x = 1 1 9 and
plot x**2 for x = 1 1 9
.
device 2 close
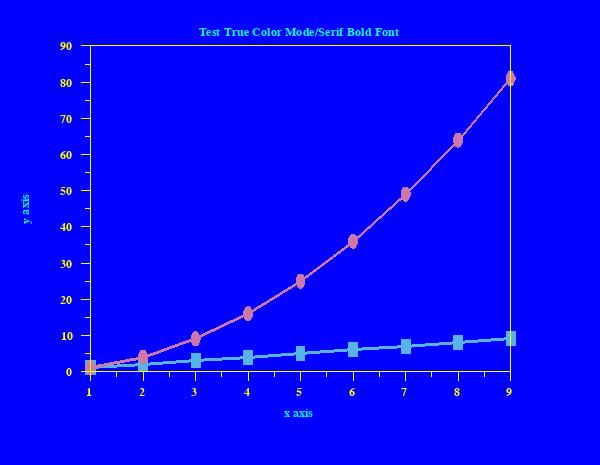
set gd color true
background color blue
. Path name for font will be implementation dependent
set gd font /usr/share/fonts/gnu-free/FreeSerifBold.ttf
set ipl1na gd2d.jpg
device 2 gd jpeg
device 2 font tektronix
.
frame color yellow
tic mark color yellow
tic mark label color yellow
title color cyan
label color cyan
.
line solid solid
line thickness 0.3 all
line color blue red
line rgb color 86 180 233 204 121 167
character size 3 3
character box circle
character fill on on
character rgb color 86 180 233 204 121 167
.
title offset 2
title Test True Color Mode/Serif Bold Font
title case asis
y1label y axis
x1label x axis
.
plot x    for x = 1 1 9 and
plot x**2 for x = 1 1 9
.
device 2 close
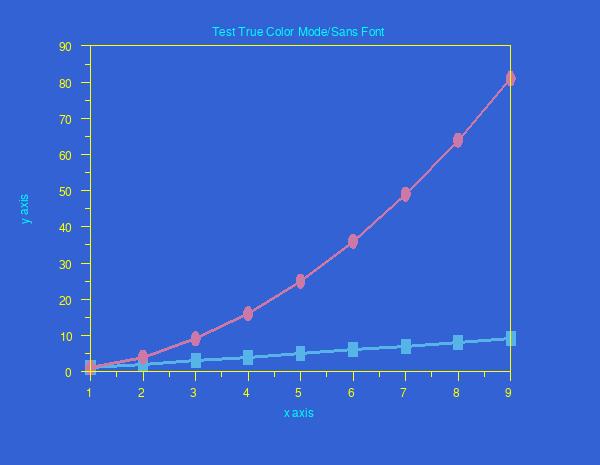
set gd color true
background rgb color 50 98 211
. Path name for font will be implementation dependent
set gd font /usr/share/fonts/gnu-free/FreeSans.ttf
set ipl1na gd2e.jpg
device 2 gd jpeg
device 2 font tektronix
.
frame color yellow
tic mark color yellow
tic mark label color yellow
title color cyan
label color cyan
.
line solid solid
line thickness 0.3 all
line color blue red
line rgb color 86 180 233 204 121 167
character size 3 3
character box circle
character fill on on
character rgb color 86 180 233 204 121 167
.
title offset 2
title Test True Color Mode/Sans Font
title case asis
y1label y axis
x1label x axis
.
plot x    for x = 1 1 9 and
plot x**2 for x = 1 1 9
.
device 2 close
Date created: 06/05/2001
Last updated: 10/13/2023
Please email comments on this WWW page to
[email protected].
|
|
