|
|
BOX COX NORMALITY PLOTName:
For each of selected members of the Box-Cox family, the transformation is carried out, a normal probability plot is computed, and the linearity of the normal probability plot is summarized via the correlation coefficient. The resulting normality plot thus consists of:
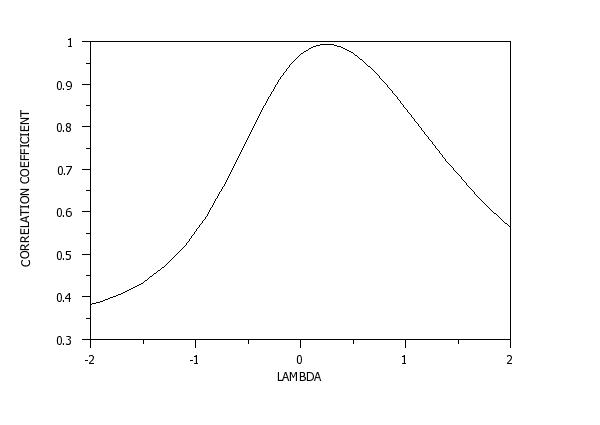
The value of the lambda parameter (on the horizontal axis) which corresponds to the maximum of the normal probability plot correlation coefficient curve (on the vertical axis) is of interest since it indicates the best-transformation member of the family. The normality technique is applicable for general transformation families. Currently, DATAPLOT only implements it for the Box-Cox family (the most important and common of the various transformation families).
<SUBSET/EXCEPT/FOR qualification> where <y> is a response variable; and where the <SUBSET/EXCEPT/FOR qualification> is optional. This syntax generates a single Box-Cox normality plot. Note that <y> can also be a matrix argument. If <y> is a matrix, a single Box-Cox normality plot is generated for all the values in the matrix.
<SUBSET/EXCEPT/FOR qualification> where <y1> ... <yk> is a list of response variables; and where the <SUBSET/EXCEPT/FOR qualification> is optional. Note that response variables can also be matrices. If a matrix name is encountered, a Box-Cox normality plot will be drawn for all the values in the matrix.
<SUBSET/EXCEPT/FOR qualification> where <y> is a response variable; <x1> is a group-id variable; and where the <SUBSET/EXCEPT/FOR qualification> is optional. A Box-Cox normality plot will be generated for each distinct value of the group-id variable. These plots will be overlaid on the same plot.
<SUBSET/EXCEPT/FOR qualification> where <y> is a response variable; <x1> is a group-id variable; <x2> is a group-id variable; and where the <SUBSET/EXCEPT/FOR qualification> is optional. The two group-id variables are cross-tabulated and a Box-Cox normality plot will be generated for each distinct combination of values for the group-id variables. These plots will be overlaid on the same plot.
BOX-COX NORMALITY PLOT Y2 MULTIPLE BOX-COX NORMALITY PLOT Y1 TO Y5 REPLICATED BOX-COX NORMALITY PLOT Y X1
LET A = BOX COX NORMALITY LAMBDA Y These return the maximum PPCC value on the Box-Cox normality plot and the corresponding value of lambda, respectively. These statistics can be used in a large number of plots and commands. For details, enter
2010/5: Support for MULTIPLE and REPLICATION options
LET Y = EXPONENTIAL RANDOM NUMBERS FOR I = 1 1 100
Y1LABEL CORRELATION COEFFICIENT
X1LABEL LAMBDA
BOX-COX NORMALITY PLOT Y
 Program 2:
title case asis
title offset 2
title automatic
label case asis
multiplot corner coordinates 0 0 100 95
multiplot scale factor 2
tic mark offset units screen
y1tic mark offset 2 0
.
let y1 = norm rand numb for i = 1 1 100
let y2 = logistic rand numb for i = 1 1 100
let y3 = double exponential rand numb for i = 1 1 100
let y4 = gumbel rand numb for i = 1 1 100
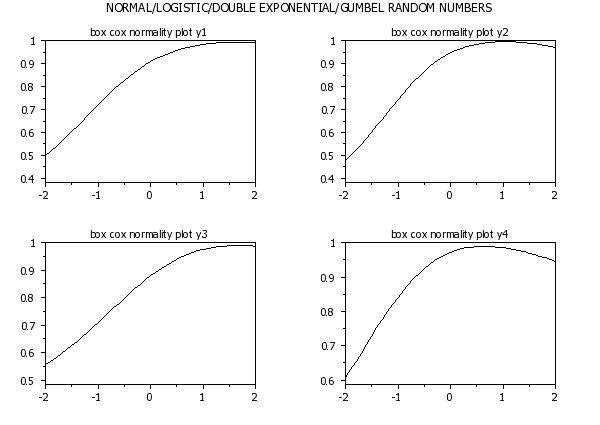
multiplot 2 2
box cox normality plot y1
box cox normality plot y2
box cox normality plot y3
box cox normality plot y4
end of multiplot
move 50 97
just center
text Normal/Logistic/Double Exponential/Gumbel Random Numbers
.
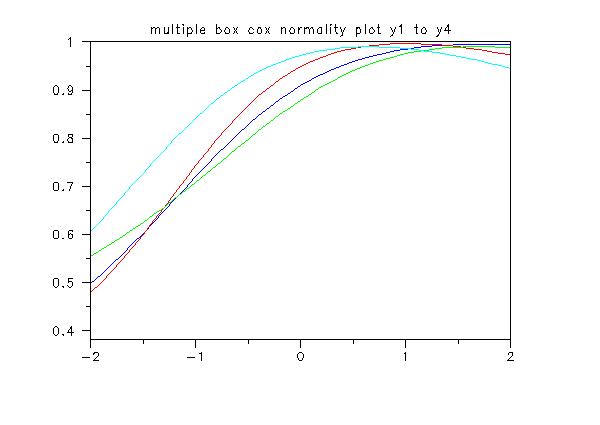
line color blue red green cyan
multiple box cox normality plot y1 to y4
.
reset data
skip 25
read rehm.dat y1 y2 x1 x2
.
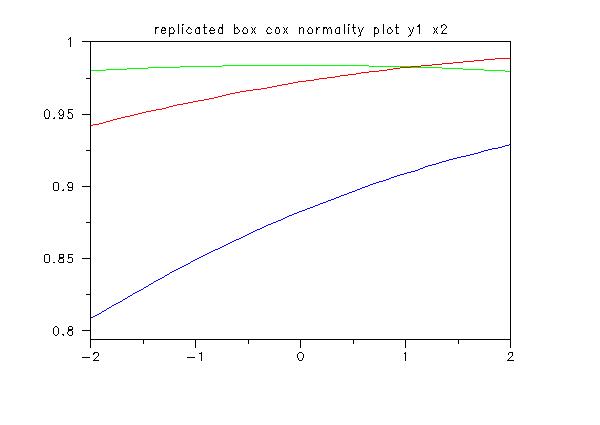
line color blue red green
replicated box cox normality plot y1 x2
Date created: 11/30/2010 |
Last updated: 12/04/2023 Please email comments on this WWW page to [email protected]. | ||||||||||||||||||||||