
|
|
BOX COX HOMOSCEDASTICITY PLOTName:
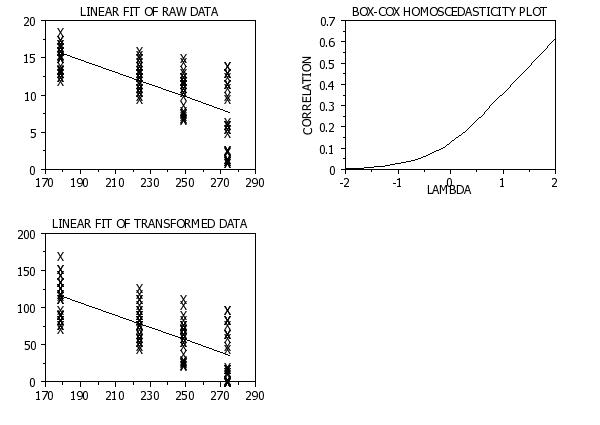
A Box-Cox homoscedasticity plot is a graphical technique for determining the Box-Cox transformation that yields the most constant variance of one variable relative to the values of a second variable. The Box-Cox family is essentially the power-transformation family (adjusted to include log transformations). The form of the family is:
There are various methods for measuring constant variance. The particular method Dataplot uses is to divide the first variable into groups with the same value for the second value. For a given value of lambda, the standard deviation is computed for each group. The statistic used is the ratio of the minimum standard deviation to the maximum standard deviation (this ratio will always be between 0 and 1). The plot then consists of this statistic on the vertical axis versus the lambda parameter on the horizontal axis. The lambda corresponding to the highest ratio is the appropriate transformation to use to provide the most constant variance. This command only applies if there is replication in the second response variable.
<SUBSET/EXCEPT/FOR qualification> where <y> is the first response variable; <x> is the second response variable; and where the <SUBSET/EXCEPT/FOR qualification> is optional.
<SUBSET/EXCEPT/FOR qualification> where <y> is the first response variable; <x> is the second response variable; <tag1> is a group-id variable; and where the <SUBSET/EXCEPT/FOR qualification> is optional. A Box-Cox homoscedasticity plot will be generated for each distinct value of the group-id variable. These plots will be overlaid on the same plot.
<SUBSET/EXCEPT/FOR qualification> where <y> is the first response variable; <x> is the second response variable; <tag1> is a group-id variable; <tag2> is a group-id variable; and where the <SUBSET/EXCEPT/FOR qualification> is optional. The two group-id variables are cross-tabulated and a Box-Cox homoscedasticity plot will be generated for each distinct combination of values for the group-id variables. These plots will be overlaid on the same plot.
REPLICATED BOX COX HOMOSCED PLOT Y X TAG
2010/5: Support for REPLICATION option
SKIP 25
READ NELSON.DAT Y X1 X2
.
MULTIPLOT CORNER COORDINATES 0 0 100 100
MULTIPLOT SCALE FACTOR 2
MULTIPLOT 2 2
FIT Y X2
LINE SOLID BLANK
CHARACTER BLANK X
TITLE LINEAR FIT OF RAW DATA
PLOT PRED Y VS X2
.
TITLE BOX-COX HOMOSCEDASTICITY PLOT
X1LABEL LAMBDA
Y1LABEL CORRELATION COEFFICIENT
BOX-COX HOMOSCEDASTICTY PLOT Y X2
.
LET YTEMP = MAXIMUM YPLOT
RETAIN XPLOT SUBSET YPLOT = YTEMP
LET LAMBDA = XPLOT(1)
LET Y2 = (Y**LAMBDA - 1)/LAMBDA
FIT Y2 X2
TITLE LINEAR FIT OF TRANSFORMED DATA
X1LABEL ; Y1LABEL
PLOT PRED Y2 VS X2
END OF MULTIPLOT
Date created: 11/30/2010 |
Last updated: 12/04/2023 Please email comments on this WWW page to [email protected]. | ||||||||||||||||