
|
BLOCK PLOTName:
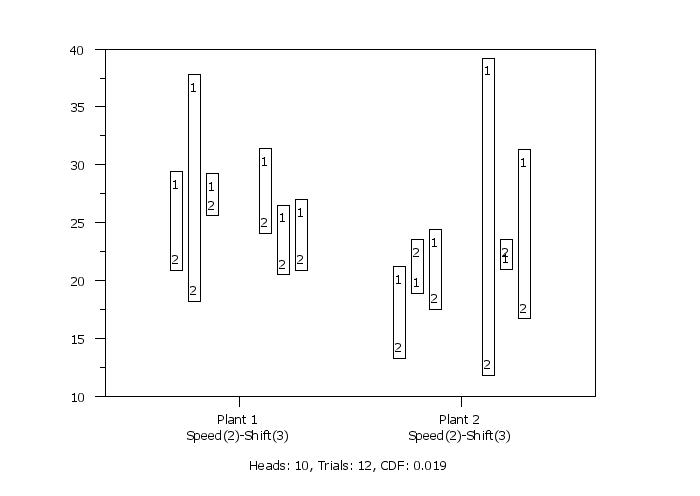
It replaces the analysis of variance test with a less assumption-dependent binomial test and should be routinely used whenever we are trying to robustly decide whether a primary factor has an effect. Block plots are formed as follows:
For example, if we have 2 nuisance factors and n1=2 and n2=2, the blocks will be set up on the X axis as follows:
          |                |          |               |
        =====================       =====================
        x2(1)            x2(2)      X2(1)           X2(2)
                 |                           |
               x1(1)                       x1(2)
The groups of block plots will be centered around the numeric
values for the levels of the x1 variable. Within each block, the
levels of the <char> variable are plotted as distinct traces at
the values of the corresponding response variable. The levels of
<char> are identified by using the CHARACTER command (e.g.,
CHAR 1 2 3; LINE BL BL BL). A box is drawn around the <char>
levels for each unique combination of factor levels (this is where
the term block plot comes from). The command BAR EXPANSION
controls the height and width of the boxes.
Syntax 1:
<SUBSET/EXCEPT/FOR qualification> where <y> is the response variable variable; <x1> ... <xk> is a list of one or more nuisance factor variables; <char> is the primary factor variable; and where the <SUBSET/EXCEPT/FOR qualification> is optional.
<SUBSET/EXCEPT/FOR qualification> where <stat> is one of Dataplot's supported statistics; <y> is the response variable variable; <x1> ... <xk> is a list of one or more nuisance factor variables; <char> is the primary factor variable; and where the <SUBSET/EXCEPT/FOR qualification> is optional. Enter HELP STATISTICS for a list of Dataplot's supported statistics. Note that only statistics requiring a single response variable are supported (e.g., MEAN BLOCK PLOT is supported, but CORRELATION BLOCK PLOT is not).
This syntax can be used when there is replication at each of the
combinations of factor levels. The requested statistic is
calculated for all the response values with the same levels of the
factor variables. The
BLOCK PLOT Y X1 X2 X3 BLOCK PLOT Y X1 X2 X3 X4 MEAN BLOCK PLOT Y X1 X2 X3
SET BLOCK PLOT LABEL <ON/OFF> SET BLOCK PLOT WIDTH <value> When the BLOCK PLOT FILTER option is ON, when a specific block only has one value for the combination of factor levels, that block will be suppressed. This option is OFF by default. The other two commands are most frequently used when the FILTER option is ON. The BLOCK PLOT LABEL will label the level of the last nuisance factor of the block. When the FILTER option results in many missing blocks, this can be helpful. The BLOCK PLOT WIDTH option allows you to manually set the width of the blocks. In most cases, this is not needed. However, it may occassionally be helpful to be able to do this. The value is set in 0 to 100 screen units. A typical value would be on the order of 0.05.
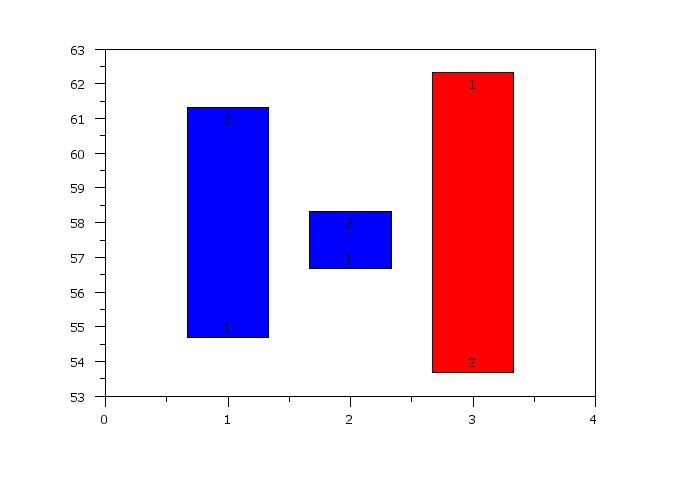
If this option is ON, you can use the REGION commands to provide a background color for the blocks. The first block uses the first arguments of the REGION commands, the second block uses the second argumemts of the REGION commands, and so on. This is demonstrated in the Program 2 example below. In some cases, you may want to give all blocks the same background. You can do this with the command
REGION FILL COLOR G75 ALL In other cases, you may want to highlight specific blocks with different colors. For example, if the blocks have two levels (say 1 and 2), you may want to color those blocks where 1 is higher than 2 with one color and those blocks where 2 is higher than 1 with another color. In this case, you need to list the specific color for each block as is demonstrated in the Program 2 example.
where <value> is a value between 0 and 1 (values less than 0 are set to 0 and values greater than 1 are set to 1). Typically this value should be less than 0.5. A value of 0 means that no jittering is applied (this is the default). This option can be useful if the plot characters within a block have significant overlap so that some of the characters are not readable. With this option, you can add some "jitter" so that the characters are offset horizontally. Specifically, a uniform random number between -<value> and +<value> will be generated and that will be added to the x-coordinate value of the character position.
2012/4: Added SET BLOCK PLOT FILTER, SET BLOCK PLOT LABEL and SET BLOCK PLOT WIDTH 2012/12: Added SET BLOCK PLOT BACKGROUND 2016/11: Added SET BLOCK PLOT JITTER
READ Y PROC PLANT SPEED SHIFT
28.4    1     1    1    1
21.9    2     1    1    1
36.8    1     1    1    2
19.2    2     1    1    2
28.2    1     1    1    3
26.6    2     1    1    3
30.4    1     1    2    1
25.1    2     1    2    1
25.5    1     1    2    2
21.5    2     1    2    2
26.0    1     1    2    3
21.9    2     1    2    3
20.2    1     2    1    1
14.3    2     2    1    1
19.9    1     2    1    2
22.5    2     2    1    2
23.4    1     2    1    3
18.5    2     2    1    3
38.2    1     2    2    1
12.8    2     2    2    1
22.0    1     2    2    2
22.5    2     2    2    2
30.3    1     2    2    3
17.7    2     2    2    3
END OF DATA
.
XLIMITS 1 2
MAJOR X1TIC MARK NUMBER 2
MINOR X1TIC MARK NUMBER 0
TIC MARK OFFSET UNITS DATA
X1TIC MARK OFFSET 0.6 0.6
X1TIC MARK LABEL FORMAT ALPHA
X1TIC MARK LABEL CASE ASIS
X1TIC MARK LABEL CONTENT PlantSP()1CR()Speed(2)-Shift(3) ...
                         PlantSP()2CR()Speed(2)-Shift(3)
.
CHARACTERS 1 2
LINE BLANK BLANK
BLOCK PLOT Y PLANT SPEED SHIFT PROC
.
LET CDF = ROUND(TAILPROB,3)
CASE ASIS
JUST CENTER
MOVE 50 5
TEXT Heads: ^heads, Trials: ^trials, CDF: ^cdf
 Program 2:
LET Y = DATA  55 61 57 58 62 54
LET X = DATA   1  1  2  2  3  3
LET TAG = DATA 1  2  1  2  1  2
.
CHARACTER 1 2
REGION FILL ON ON ON
REGION FILL COLOR BLUE BLUE RED
.
SET BLOCK PLOT BACKGROUND ON
BLOCK PLOT Y X TAG

Date created: 02/10/2015 |
Last updated: 12/04/2023 Please email comments on this WWW page to [email protected]. | ||||||||||||||||||||||||||||||||||||||||