
|
|
ANDERSON DARLING TESTName:
NOTE: This command has been replaced with the unified GOODNESS OF FIT command.
Note that the uniform (0,1) case can be used for fully specified distributions (i.e., the shape, location, and scale parameters are not estimated from the data). Simply apply the appropriate CDF function to the data (this transforms it to a (0,1) interval) and apply the uniform (0,1) test to the transformed data. More formally, the test is defined as follows.
Note that relevant parameters for the distribution being tested are estimated from the data.
where <DIST> is NORMAL, LOGNORMAL, WEIBULL, EXPONENTIAL, EV1, LOGISTIC, DOUBLE EXPONENTIAL, UNIFORM, GENERALIZED PARETO; <y> is the response variable; and where the <SUBSET/EXCEPT/FOR qualification> is optional.
ANDERSON DARLING TEST Y ANDERSON DARLING LOGNORMAL TEST Y ANDERSON DARLING EXPONENTIAL TEST Y ANDERSON DARLING WEIBULL TEST Y ANDERSON DARLING NORMAL TEST Y SUBSET GROUP = 2 TO 4
For some of the distributions, you can specify your own estimates of the parameters. Specifically,
LET BETA = <value of scale parameter> ANDERSON DARLING LOGISTIC TEST Y
LET GAMMA = <value of shape parameter>
LET GAMMA = <value of shape parameter> The maximum likelihood estimation for the generalized Pareto distribution is still undergoing algorithmic development, so it is suggested that you estimate the parameters using some other method (e.g., PPCC PLOT) first and then apply the Anderson-Darling test.
"Asymptotic Results for Goodness-of-Fit Statistics with Unknown Parameters", Stephens, M. A. (1976), Annals of Statistics, Vol. 4, pp. 357-369. "Goodness of Fit for the Extreme Value Distribution", Stephens, M. A. (1977), Biometrika, Vol. 64, pp. 583-588. "Goodness of Fit with Special Reference to Tests for Exponentiality", Stephens, M. A. (1977), Technical Report No. 262, Department of Statistics, Stanford University, Stanford, CA. "Tests of Fit for the Logistic Distribution Based on the Empirical Distribution Function", Stephens, M. A. (1979), Biometrika, Vol. 66, pp. 591-595. "Goodness-of-Fit Tests for the Generalized Pareto Distribution", V. Choulakian and M. A. Stephens, Technometrics, November, 2001, Vol. 43, No. 4, pp. 478-484. "MIL-HDBK-17 Volume 1: Guidelines for Characterization of Structural Materials", Depeartment of Defense, chapter 8. The URL for MIL-HDBK-17 is http://mil-17.udel.edu/.
2000/10: Fix to estimate shape and scale parameters for Weibull 2003/10: Support for CAPTURE HTML and CAPTURE LATEX 2003/11: Support for logistic, double exponential, and uniform (0,1) distributions 2004/4: Support for the generalized Parteto distribution
READ VANGEL31.DAT Y ANDERSON DARLING EXPONENTIAL TEST Y
    The following output is generated:


           *******************************************
           **  anderson darling exponential test y  **
           *******************************************


                   ANDERSON DARLING 1-SAMPLE TEST
                   THAT THE DATA COME FROM A EXPONENTIAL          DISTRIBUTION

     1. STATISTICS:
           NUMBER OF OBSERVATIONS                =       38
           LOCATION PARAMETER                    =    185.7895
           SCALE PARAMETER                       =    18.59549

           ANDERSON DARLING TEST STATISTIC VALUE =    14.35715

     2. CRITICAL VALUES:
           90         % POINT    =    1.062000
           95         % POINT    =    1.321000
           97.5       % POINT    =    1.591000
           99         % POINT    =    1.959000

     3. CONCLUSION (AT THE 5% LEVEL):
           THE DATA DO NOT COME FROM A EXPONENTIAL         DISTRIBUTION.
Date created: 06/05/2001 |
Last updated: 12/04/2023 Please email comments on this WWW page to [email protected]. | ||||||||||||||||||||||||||
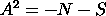
![S = SUM((2*i-1)/N)[LOG(F(Y(i)+LOG(1-F(Y(N+1-i)))]
where the summation is from 1 to N](eqns/adstat2.gif)