5.6. Case Studies
5.6.2. Sonoluminescent Light Intensity Case Study
5.6.2.9. |
Next Step: DOE Contour Plot |
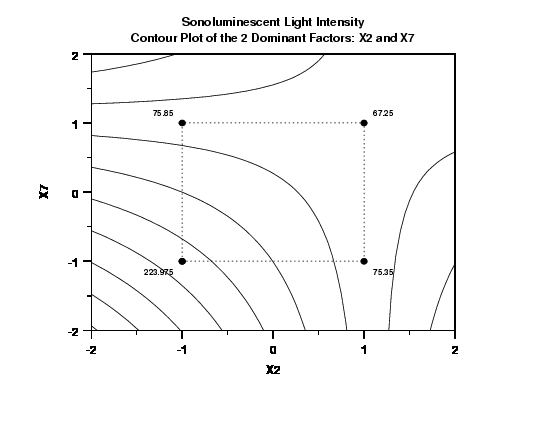
From the previous plots, we identified X2 (solute) and X7 (horn depth) as the two most important factors.

- The best (high light intensity) setting for X2 is "-"
and the best setting for X7 is "-". This combination
yields an average response of approximately 224. The next
highest average response from any other combination of these
factors is only 76.
- The non-linear nature of the contour lines implies that the
X2*X7 interaction is important.
- On the left side of the plot from top to bottom, the contour
lines start at 0, increment by 50 and stop at 400. On the
bottom of the plot from right to left, the contour lines start
at 0, increment by 50 and stop at 400.
To achieve a light intensity of, say 400, this suggests an extrapolated best setting of (X2, X7) = (-2,-2).
- Such extrapolation only makes sense if X2 and X7 are continuous factors. Such is not the case here. In this example, X2 is solute (-1 = sugar and +1 = glycerol) and X7 is flask clamping (-1 is unclamped and +1 is clamped). Both factors are discrete, and so extrapolated settings are not possible.

