
5.6. Case Studies
5.6.2. Sonoluminescent Light Intensity Case Study
5.6.2.8. |
Cumulative Residual Standard Deviation Plot |
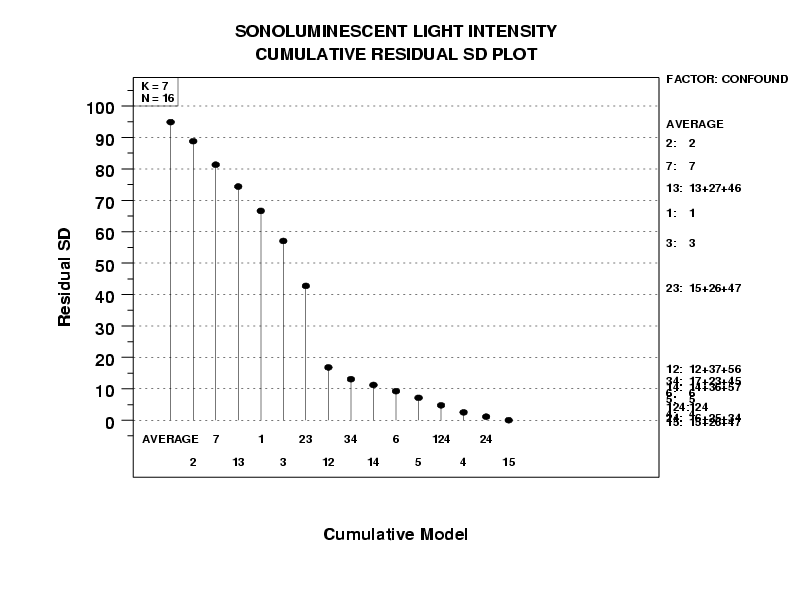
- The baseline model consisting only of the average
(\( \scriptsize \hat{Y} \)
= 110.6063) has a high residual standard deviation (95).
- The cumulative residual standard deviation shows a significant
and steady decrease as the following terms are added to the
average: X2, X7, X1*X3, X1,
X3, X2*X3, and X1*X2.
Including these terms reduces the cumulative residual standard
deviation from approximately 95 to approximately 17.
- Exclude from the model any term after X1*X2 as
the decrease in the residual standard deviation becomes
relatively small.
- From the |effects| plot, we see
that the average is 110.6063, the estimated X2 effect is
-78.6126, and so on. (The model coefficients are one half of the
effect estimates.) We use this to from the following
prediction equation:
-
\( \begin{eqnarray*}
\hat{Y} & = & 110.6063 - 39.3063 X_2 - 39.0563 X_7 + \\
& & 35.00625 X_1 X_3 + 33.106245 X_1 +
31.90625 X_3 - \\
& & 31.7313 X_1 X_5 - 29.781 X_1 X_2
\end{eqnarray*}
\)
Note that X1*X3 is confounded with X2*X7 and X4*X6, X1*X5 is confounded with X2*X6 and X4*X7, and X1*X2 is confounded with X3*X7 and X5*X6.
From the above graph, we see that the residual standard deviation for this model is approximately 17.
