5.6. Case Studies
5.6.2. Sonoluminescent Light Intensity Case Study
5.6.2.3. |
Interaction Effects |
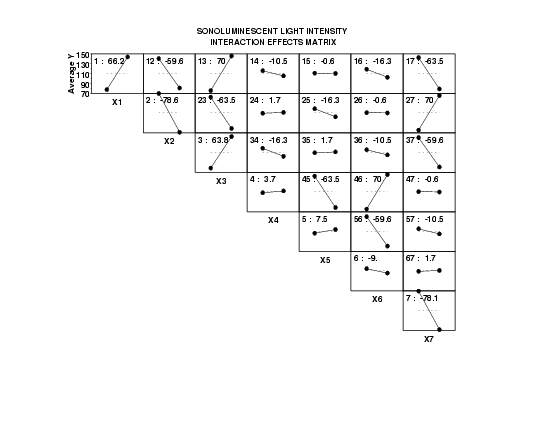
- Important Factors: Looking for the plots that have the steepest
lines (that is, the largest effects), and noting that the legends
on each subplot give the estimated effect, we have that
- The diagonal plots are the main effects. The important
factors are: X2, X7, X1, and
X3. These four factors have |effect| > 60. The
remaining three factors have |effect| < 10.
- The off-diagonal plots are the 2-factor interaction
effects. Of the 21 2-factor interactions, 9 are nominally
important, but they fall into three groups of three:
- X1*X3, X4*X6, X2*X7 (effect = 70)
- X2*X3, X4*X5, X1*X7 (effect approximately 63.5)
- X1*X2, X5*X6, X3*X7 (effect = -59.6)
All remaining 2-factor interactions are small having an |effect| < 20. A virtue of the interaction effects matrix plot is that the confounding structure of this Resolution IV design can be read off the plot. In this case, the fact that X1*X3, X4*X6, and X2*X7 all have effect estimates identical to 70 is not a mathematical coincidence. It is a reflection of the fact that for this design, the three 2-factor interactions are confounded. This is also true for the other two sets of three (X2*X3, X4*X5, X1*X7, and X1*X2, X5*X6, X3*X7).
- The diagonal plots are the main effects. The important
factors are: X2, X7, X1, and
X3. These four factors have |effect| > 60. The
remaining three factors have |effect| < 10.
- Best Settings: Reading down the diagonal plots, we select,
as before, the best settings "on the average":
-
(X1,X2,X3,X4,X5,X6,X7)
= (+,-,+,+,+,-,-)
For the more important factors (X1, X2, X3, X7), we note that the best settings (+, -, +, -) are consistent with the best settings for the 2-factor interactions (cross-products):
-
X1: +, X2: - with X1*X2: -
X1: +, X3: + with X1*X3: +
X1: +, X7: - with X1*X7: -
X2: -, X3: + with X2*X3: -
X2: -, X7: - with X2*X7: +
X3: +, X7: - with X3*X7: -


