3.
Production
Process Characterization
3.5.
Case Studies
3.5.2.
Machine Screw Case Study
3.5.2.2.
|
Box Plots by Factors
|
|
|
Initial Steps
|
The initial step is to plot
box plots
of the measured diameter for each of the explanatory variables.
|
|
Box Plot by Machine
|
The following is a box
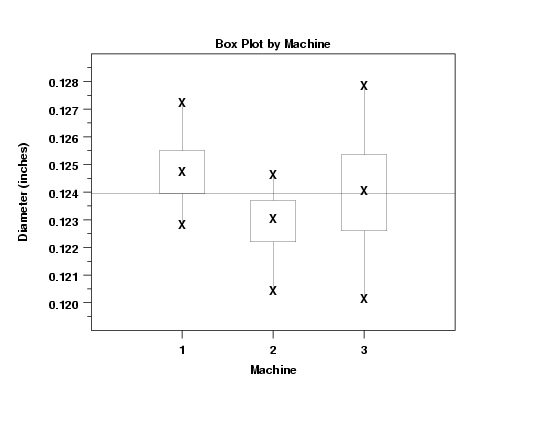
plot of the diameter by machine.

|
|
Conclusions From Box Plot
|
We can make the following conclusions from this box plot.
- The location appears to be significantly different
for the three machines, with machine 2 having the
smallest median diameter and machine 1 having the
largest median diameter.
- Machines 1 and 2 have comparable variability while machine 3
has somewhat larger variability.
|
|
Box Plot by Day
|
The following is a box
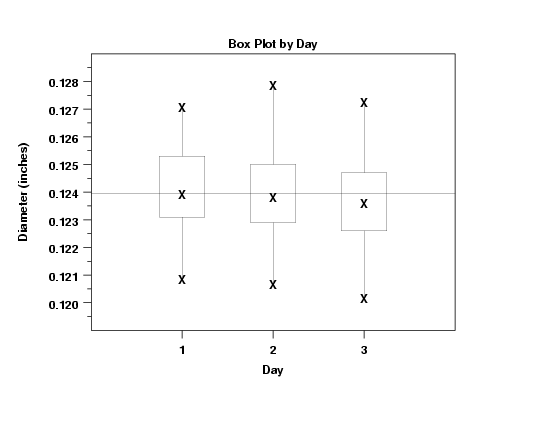
plot of the diameter by day.

|
|
Conclusions From Box Plot
|
We can draw the following conclusion from this box plot. Neither
the location nor the spread seem to differ significantly by day.
|
|
Box Plot by Time of Day
|
The following is a box
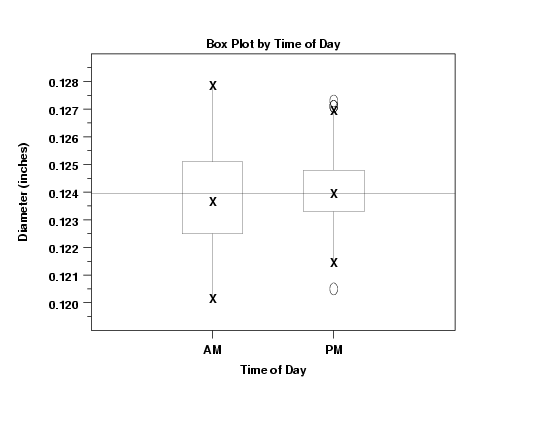
plot of the time of day.

|
|
Conclusion From Box Plot
|
We can draw the following conclusion from this box plot.
Neither the location nor the spread seem to differ
significantly by time of day.
|
|
Box Plot by Sample Number
|
The following is a box
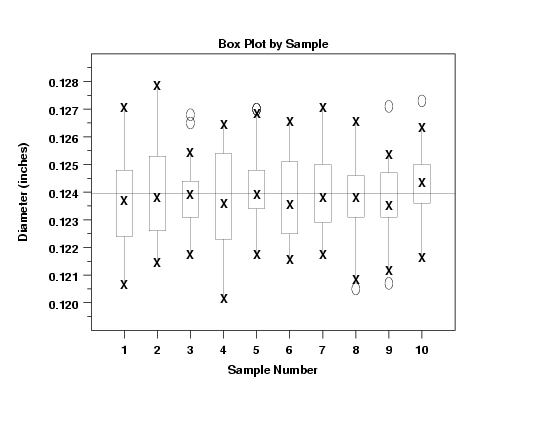
plot of the sample number.

|
|
Conclusion From Box Plot
|
We can draw the following conclusion from this box plot.
Although there are some minor differences in location and
spread between the samples, these differences do not show
a noticeable pattern and do not seem significant.
|


