|
Model relationships using fishbone diagrams
|
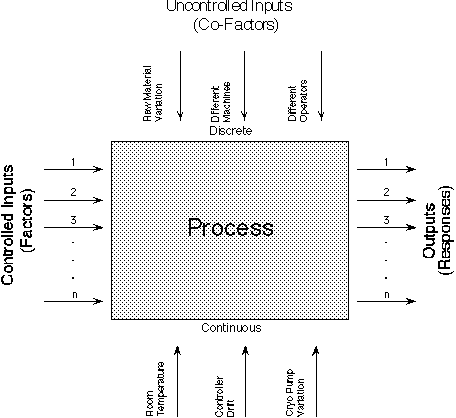
The next step is to model relationships of the previously identified
factors and responses. In this step we choose a parameter and identify
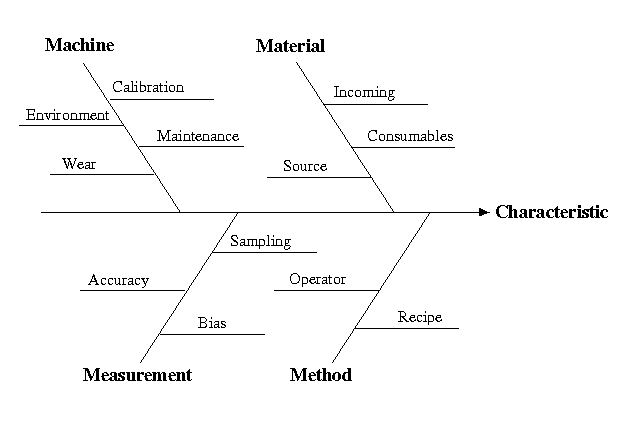
all of the other parameters that may have an influence on it. This
process is easily documented with fishbone diagrams as illustrated in the
figure below. The influenced parameter is put on the center line and the
influential factors are listed off of the centerline and can be grouped
into major categories like Tool, Material, Work Methods and Environment.
|


