6.3. Univariate and Multivariate Control Charts
6.3.4. |
What are Multivariate Control Charts? |
\(T^2\) statistic


|
6.
Process or Product Monitoring and Control
6.3. Univariate and Multivariate Control Charts
|
|||
|
Multivariate control charts and Hotelling's
\(T^2\) statistic |
It is a fact of life that most data are naturally multivariate. Hotelling in 1947 introduced a statistic which uniquely lends itself to plotting multivariate observations. This statistic, appropriately named Hotelling's \(T^2\), is a scalar that combines information from the dispersion and mean of several variables. Due to the fact that computations are laborious and fairly complex and require some knowledge of matrix algebra, acceptance of multivariate control charts by industry was slow and hesitant. | ||
| Multivariate control charts now more accessible | Nowadays, modern computers in general and the PC in particular have made complex calculations accessible and during the last decade, multivariate control charts were given more attention. In fact, the multivariate charts which display the Hotelling \(T^2\) statistic became so popular that they sometimes are called Shewhart charts as well (e.g., Crosier, 1988), although Shewhart had nothing to do with them. | ||
| Hotelling charts for both means and dispersion | As in the univariate case, when data are grouped, the \(T^2\) chart can be paired with a chart that displays a measure of variability within the subgroups for all the analyzed characteristics. The combined \(T^2\) and \(T_d^2\) (dispersion) charts are thus a multivariate counterpart of the univariate \(\bar{X}\) and \(S\) (or \(\bar{X}\) and \(R\)) charts. | ||
| Hotelling mean and dispersion control charts |
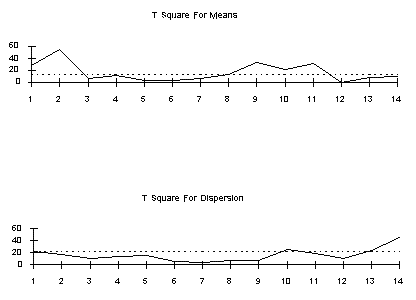
An example of a Hotelling \(T^2\)
and \(T_d^2\)
pair of charts is given below:
|
||
| Interpretation of sample Hotelling control charts | Each chart represents 14 consecutive measurements on the means of four variables. The \(T^2\) chart for means indicates an out-of-control state for groups 1,2 and 9-11. The \(T_d^2\) chart for dispersions indicate that groups 10, 13 and 14 are also out of control. The interpretation is that the multivariate system is suspect. To find an assignable cause, one has to resort to the individual univariate control charts or some other univariate procedure that should accompany this multivariate chart. | ||
| Additional discussion | For more details and examples see the next page and also Tutorials, section 5, subsections 4.3, 4.3.1 and 4.3.2. An introduction to Elements of multivariate analysis is also given in the Tutorials. | ||
