6.3. Univariate and Multivariate Control Charts
6.3.3. What are Multivariate Control Charts?
6.3.3.3. |
Multivariate EWMA Charts |
The model for a univariate EWMA chart is given by:

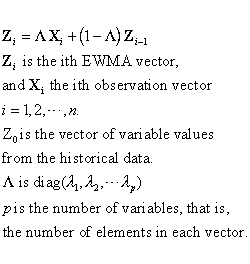
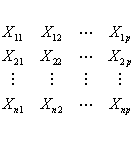
In the multivariate case, one can extend this formula to

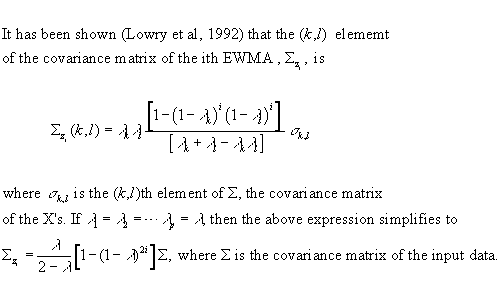

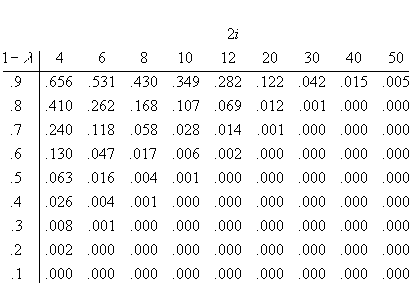
The following table gives the values of (1-l) 2i for selected values of l and i.
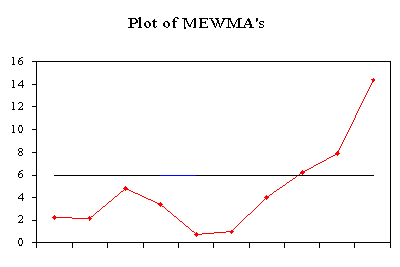
Here is an example of the application of an MEWMA control chart. To
faciltate comparison with existing literature we used data from Lowry etal.
The data was simulated from a bivariate normal distribution with unit
variances and a correlation coefficient of .5. The value for l = .10 and
the values for T2i were obtained by the equation given above. The covariance
of the mewma vectors was obtained by using the non-simplified equation.
That means that for every of the i mewma control statistic, the computer
computed a covariance matrix , where i = 1, 2, ...10.The results of the
computer routine are:
*****************************************************
* Multi-Variate
EWMA Control Chart
* ******************************************************
DATA SERIES
MEWMA Vector
MEWMA
1
2 1
2 STATISTIC
-1.190 0.590
-0.119 0.059
2.1886
0.120 0.900
-0.095 0.143
2.0697
-1.690 0.400
-0.255 0.169
4.8365
0.300 0.460
-0.199 0.198
3.4158
0.890 -0.750
-0.090 0.103
0.7089
0.820 0.980
0.001 0.191
0.9268
-0.300 2.280
-0.029 0.400
4.0018
0.630 1.750
0.037 0.535
6.1657
1.560 1.580
0.189 0.639
7.8554
1.460 3.050
0.316 0.880
14.4158
VEC XBAR
MSE Lamda
1 .260
1.200 0.100
2 1.124
1.774 0.100
The UCL = 5.938 for a = .05
