

|
2.
Measurement Process Characterization
2.6. Case studies 2.6.1. Gauge study of resistivity probes
|
|||
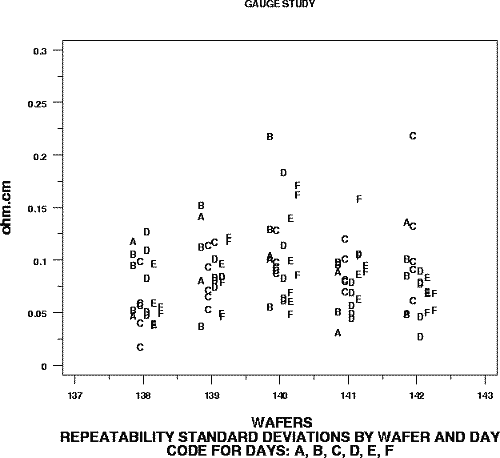
| Run 1 - Graph of repeatability standard deviations for probe #2362 -- 6 days and 5 wafers showing that repeatability is constant across wafers and days |

|
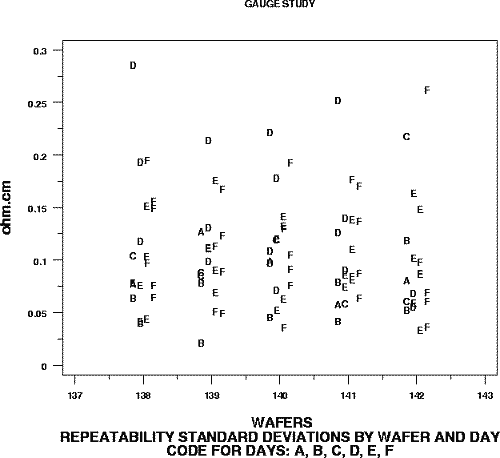
| Run 2 - Graph of repeatability standard deviations for probe #2362 -- 6 days and 5 wafers showing that repeatability is constant across wafers and days |

|
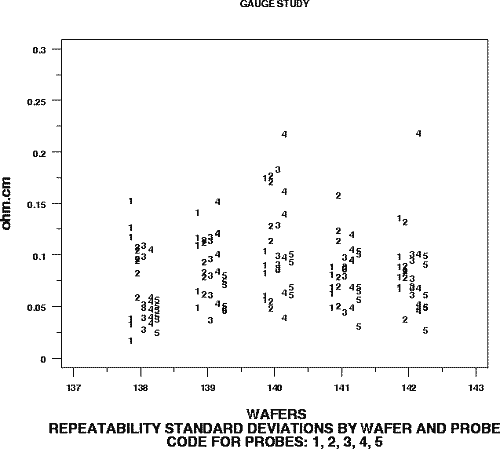
| Run 1 - Graph showing repeatability standard deviations for five probes as a function of wafers and probes |

|
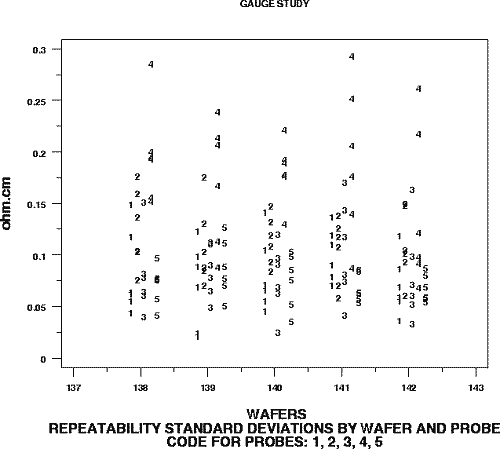
| Run 2 - Graph showing repeatability standard deviations for 5 probes as a function of wafers and probes |

|
