2.
Measurement Process Characterization
2.3. Calibration 2.3.6. Instrument calibration over a regime 2.3.6.4. What can go wrong with the calibration procedure
|
|||
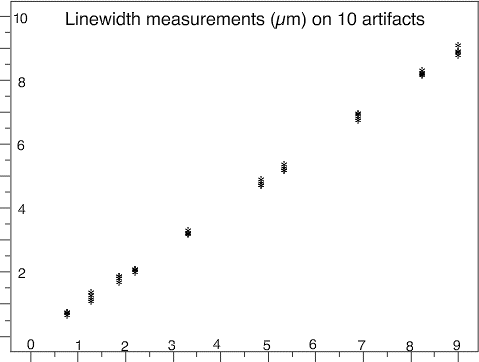
Calibration data over 4 days | Line width measurements on 10 NIST reference standards were made with an optical imaging system on each of four days. The four data points for each reference value appear to overlap in the plot because of the wide spread in reference values relative to the precision. The plot suggests that a linear calibration line is appropriate for calibrating the imaging system. | ||
This plot shows measurements made on 10 reference materials repeated on four days with the 4 points for each day overlapping |
REFERENCE VALUES (μm) |
||
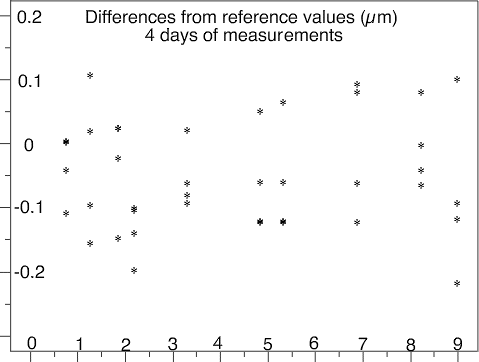
This plot shows the differences between each measurement and the corresponding reference value. Because days are not identified, the plot gives no indication of problems in the control of the imaging system from from day to day. |
REFERENCE VALUES (μm) |
||
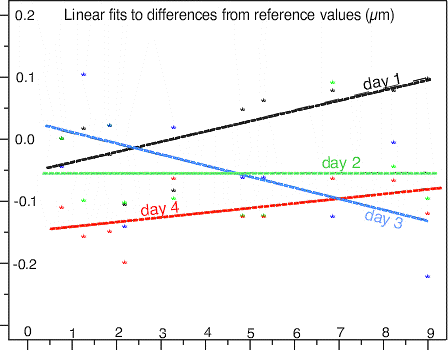
This plot, with linear calibration lines fit to each day's measurements individually, shows how the response of the imaging system changes dramatically from day to day. Notice that the slope of the calibration line goes from positive on day 1 to negative on day 3. |
|
||
Interpretation of calibration findings | Given the lack of control for this measurement process, any calibration procedure built on the average of the calibration data will fail to properly correct the system on some days and invalidate resulting measurements. There is no good solution to this problem except daily calibration. |