2.3. Calibration
2.3.6. |
Instrument calibration over a regime |
- The instrument reads in the same units as the reference standards. The purpose of the calibration is to identify and eliminate any bias in the instrument relative to the defined unit of measurement. For example, optical imaging systems that measure the width of lines on semiconductors read in micrometers, the unit of interest. Nonetheless, these instruments must be calibrated to values of reference standards if line width measurements across the industry are to agree with each other.
- The instrument reads in different units than the reference standards. The purpose of the calibration is to convert the instrument readings to the units of interest. An example is densitometer measurements that act as surrogates for measurements of radiation dosage. For this purpose, reference standards are irradiated at several dosage levels and then measured by radiometry. The same reference standards are measured by densitometer. The calibrated results of future densitometer readings on medical devices are the basis for deciding if the devices have been sterilized at the proper radiation level.
- Selection of reference standards with known values to cover the range of interest.
- Measurements on the reference standards with the instrument to be calibrated.
- Functional relationship between the measured and known values of the reference standards (usually a least-squares fit to the data) called a calibration curve.
- Correction of all measurements by the inverse of the calibration curve.
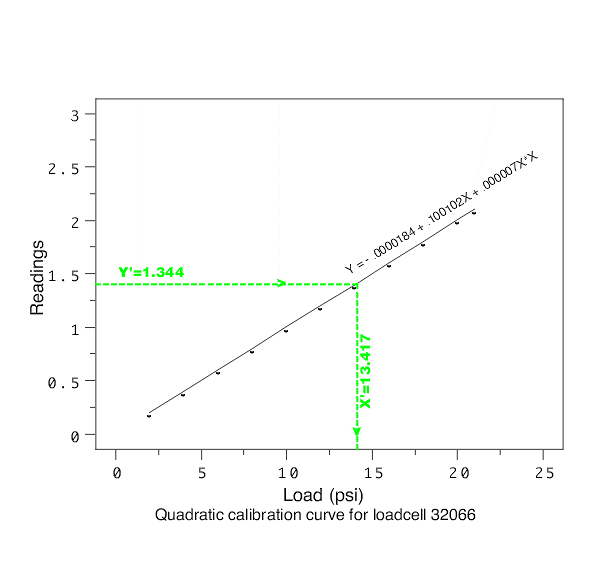
A quadratic fit to the loadcell data produces
the calibration curve that is shown as the solid line. For a future
measurement with the load cell, Y' = 1.344 on the y-axis,
a dotted line is drawn through Y' parallel to the x-axis.
At the point where it intersects the calibration curve, another
dotted line is drawn parallel to the y-axis. Its point of
intersection with the x-axis at X' = 13.417 is the
calibrated value.


