1.4. EDA Case Studies
1.4.2. Case Studies
1.4.2.10. Ceramic Strength
1.4.2.10.5. |
Analysis of Primary Factors |
Since the previous pages showed a significant batch effect but a minimal lab effect, we will generate separate plots for batch 1 and batch 2. However, the labs will be treated as equivalent.
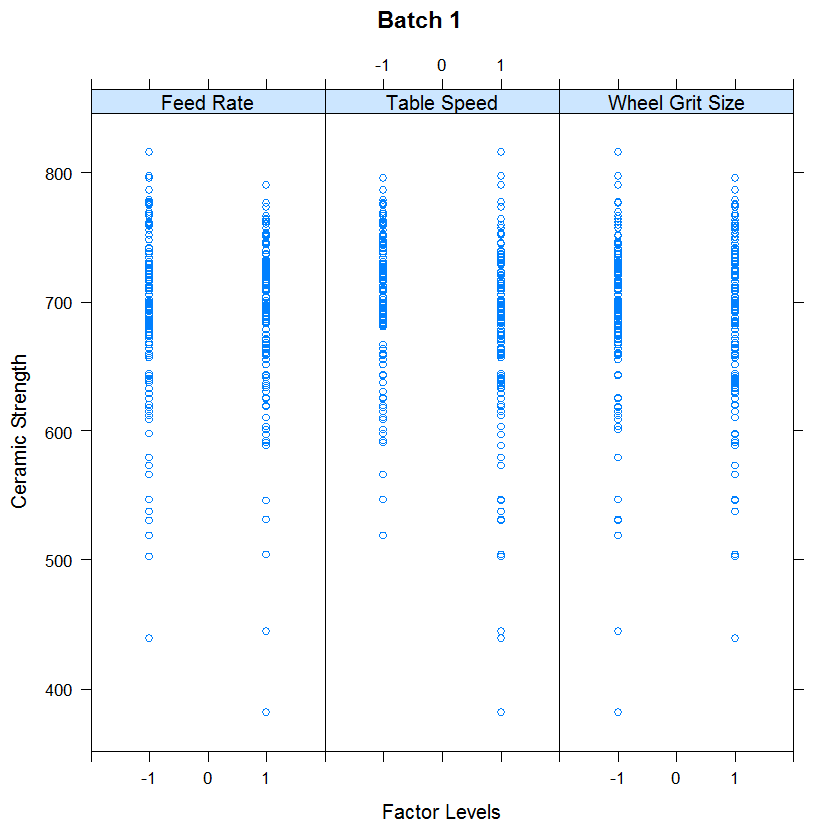
This DOE scatter plot shows the following for batch 1.
- Most of the points are between 500 and 800.
- There are about a dozen or so points between 300 and 500.
- Except for the outliers on the low side (i.e., the points between 300 and 500), the distribution of the points is comparable for the 3 primary factors in terms of location and spread.
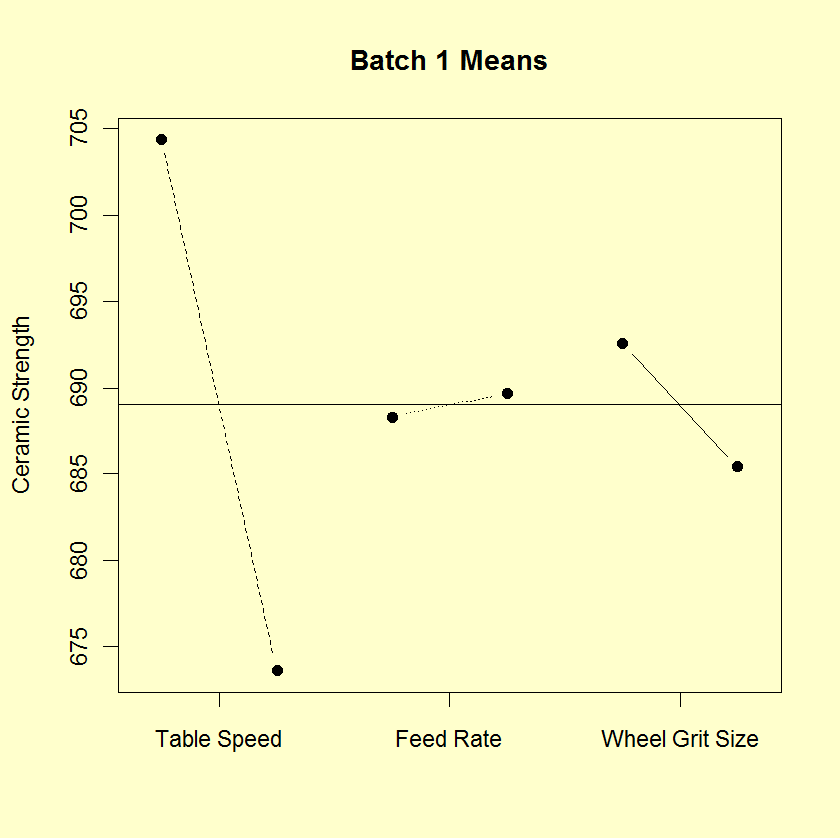
This DOE mean plot shows the following for batch 1.
- The table speed factor (X1) is the most significant factor
with an effect, the difference between the two points,
of approximately 35 units.
- The wheel grit factor (X3) is the next most significant
factor with an effect of approximately 10 units.
- The feed rate factor (X2) has minimal effect.
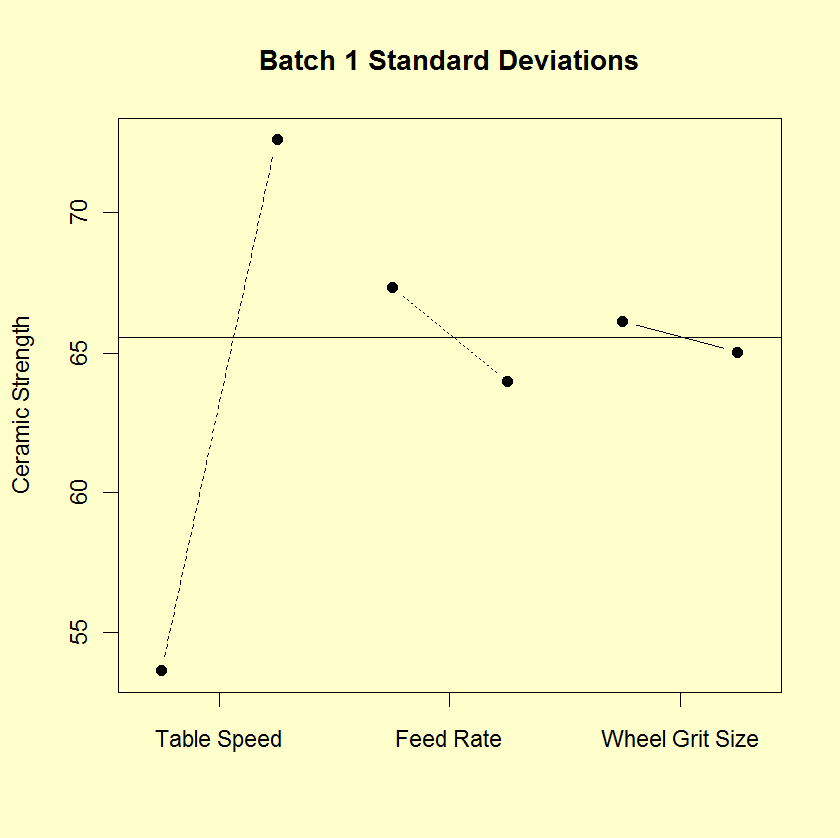
This DOE standard deviation plot shows the following for batch 1.
- The table speed factor (X1) has a significant difference
in variability between the levels of the factor. The
difference is approximately 20 units.
- The wheel grit factor (X3) and the feed rate factor (X2) have minimal differences in variability.
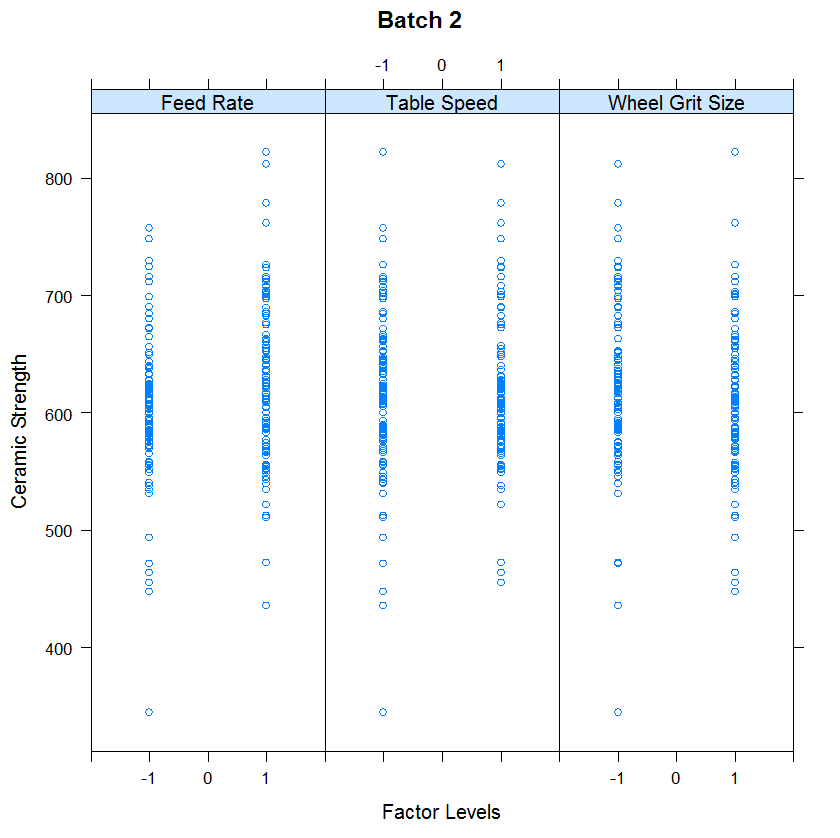
This DOE scatter plot shows the following for batch 2.
- Most of the points are between 450 and 750.
- There are a few outliers on both the low side and the
high side.
- Except for the outliers (i.e., the points less than 450 or greater than 750), the distribution of the points is comparable for the 3 primary factors in terms of location and spread.
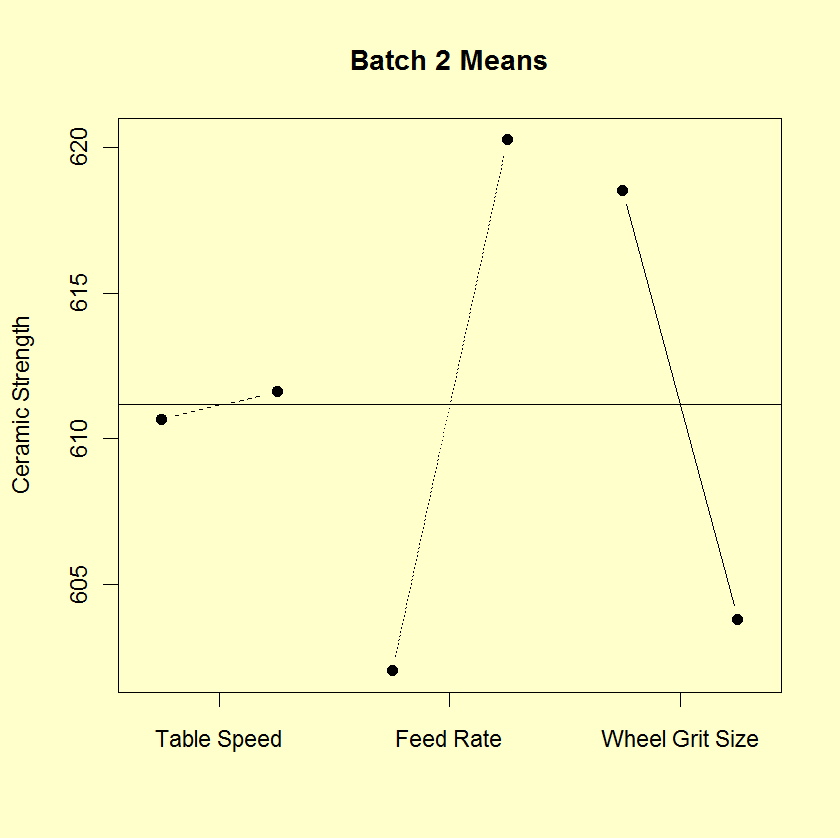
This DOE mean plot shows the following for batch 2.
- The feed rate (X2) and wheel grit (X3) factors have an
approximately equal effect of about 15 or 20 units.
- The table speed factor (X1) has a minimal effect.
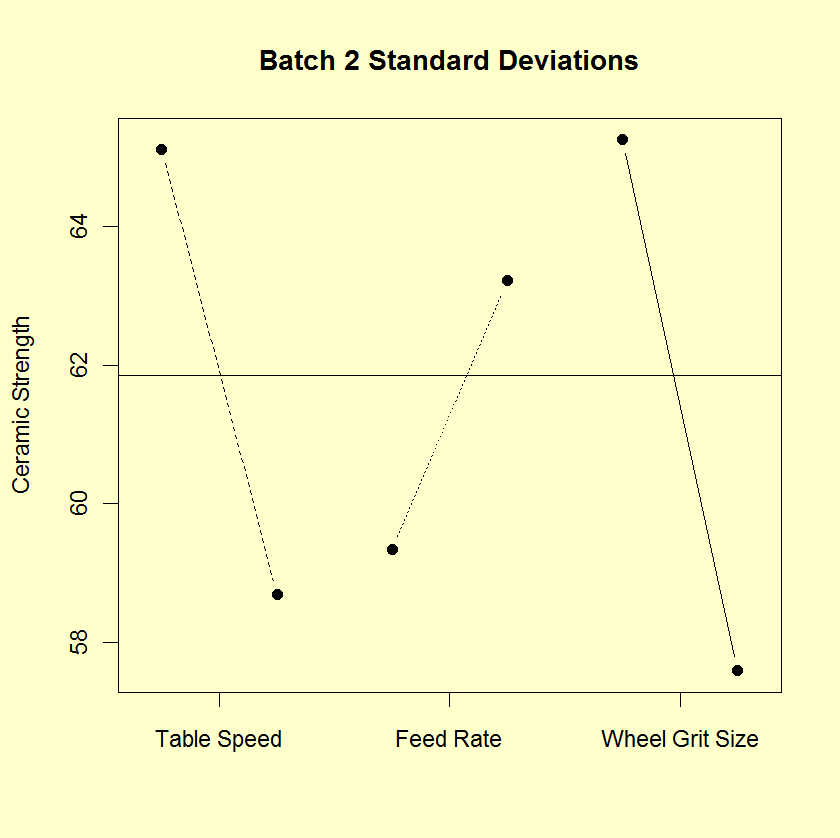
This DOE standard deviation plot shows the following for batch 2.
- The difference in the standard deviations is roughly comparable for the three factors (slightly less for the feed rate factor).
Main effects and 2-term interaction effects are discussed in the chapter on Process Improvement.
In the following DOE interaction plots, the labels on the plot give the variables and the estimated effect. For example, factor 1 is table speed and it has an estimated effect of 30.77 (it is actually -30.77 if the direction is taken into account).
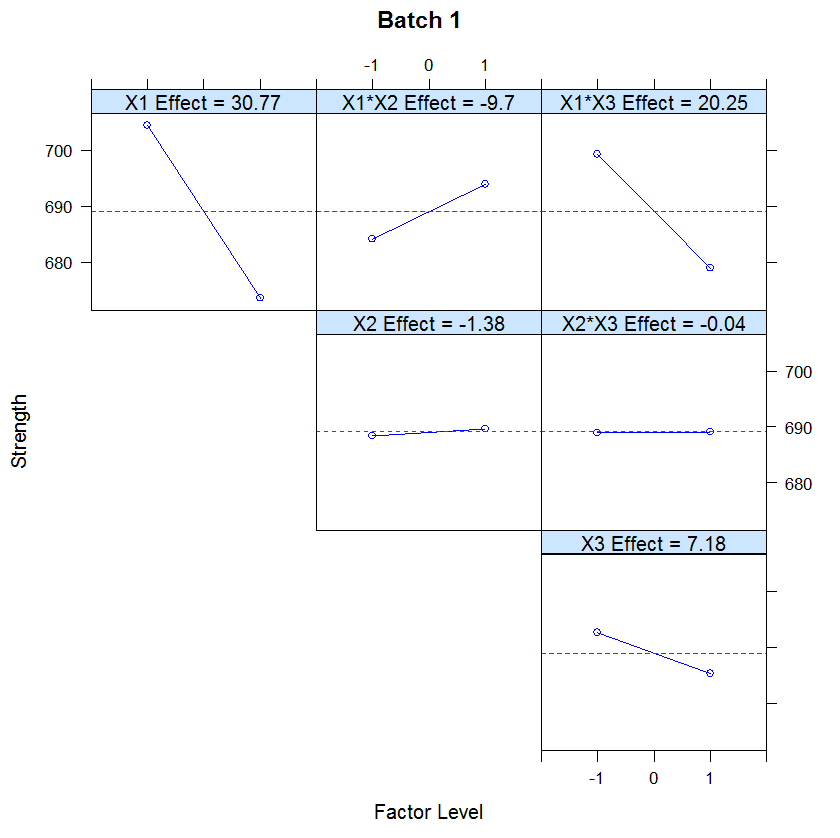
The ranked list of factors for batch 1 is:
- Table speed (X1) with an estimated effect of -30.77.
- The interaction of table speed (X1) and wheel grit (X3)
with an estimated effect of -20.25.
- The interaction of table speed (X1) and feed rate (X2) with
an estimated effect of 9.7.
- Wheel grit (X3) with an estimated effect of -7.18.
- Down feed (X2) and the down feed interaction with wheel grit (X3) are essentially zero.
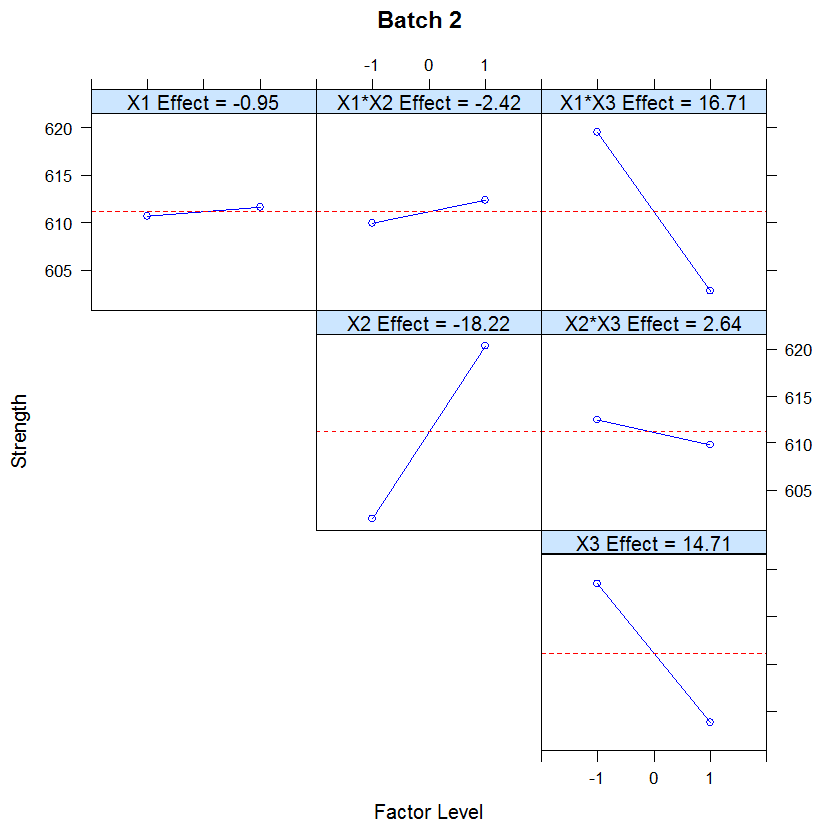
The ranked list of factors for batch 2 is:
- Down feed (X2) with an estimated effect of 18.22.
- The interaction of table speed (X1) and wheel grit (X3)
with an estimated effect of -16.71.
- Wheel grit (X3) with an estimated effect of -14.71
- Remaining main effect and 2-factor interaction effects are essentially zero.
- The batch effect (of approximately 75 units) is the
dominant primary factor.
- The most important factors differ from batch to batch. See the above text for the ranked list of factors with the estimated effects.

