1.3. EDA Techniques
1.3.3. Graphical Techniques: Alphabetic
1.3.3.15. Lag Plot
1.3.3.15.3. |
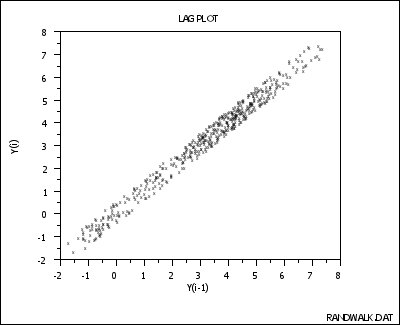
Lag Plot: Strong Autocorrelation and Autoregressive Model |

- The data come from an underlying autoregressive model with strong positive autocorrelation
- The data contain no outliers.
If the above process were completely random, the plot would have a shotgun pattern, and knowledge of a current observation (say Yi-1 = 3) would yield virtually no knowledge about the next observation Yi (it could here be anywhere from -2 to +8). On the other hand, if the process had strong autocorrelation, as seen above, and if Yi-1 = 3, then the range of possible values for Yi is seen to be restricted to a smaller range (2 to 4)--still wide, but an improvement nonetheless (relative to -2 to +8) in predictive power.
- Extimate the parameters for the autoregressive model:
-
\[ Y_{i} = A_0 + A_1*Y_{i-1} + E_{i} \]
Since Yi and Yi-1 are precisely the axes of the lag plot, such estimation is a linear regression straight from the lag plot.
The residual standard deviation for this autoregressive model will be much smaller than the residual standard deviation for the default model
-
\[ Y_{i} = A_0 + E_{i} \]
- Reexamine the system to arrive at an explanation for the
strong autocorrelation. Is it due to the
- phenomenon under study; or
- drifting in the environment; or
- contamination from the data acquisition system?
Sometimes the source of the problem is contamination and carry-over from the data acquisition system where the system does not have time to electronically recover before collecting the next data point. If this is the case, then consider slowing down the sampling rate to achieve randomness.

