1.3. EDA Techniques
1.3.3. Graphical Techniques: Alphabetic
1.3.3.15. Lag Plot
1.3.3.15.1. |
Lag Plot: Random Data |

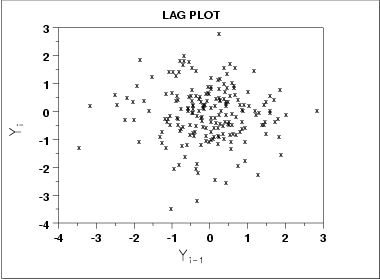
- The data are random.
- The data exhibit no autocorrelation.
- The data contain no outliers.

|
1.
Exploratory Data Analysis
1.3. EDA Techniques 1.3.3. Graphical Techniques: Alphabetic 1.3.3.15. Lag Plot
|
|||
| Lag Plot |

|
||
| Conclusions |
We can make the following conclusions based on the above plot of
200 normal random numbers.
|
||
| Discussion | The lag plot shown above is for lag = 1. Note the absence of structure. One cannot infer, from a current value Yi-1, the next value Yi. Thus for a known value Yi-1 on the horizontal axis (say, Yi-1 = +0.5), the Yi-th value could be virtually anything (from Yi = -2.5 to Yi = +1.5). Such non-association is the essence of randomness. | ||
