Next Page Previous Page Home Tools & Aids Search Handbook
1. Exploratory Data Analysis
1.3. EDA Techniques
1.3.3. Graphical Techniques: Alphabetic
1.3.3.26. Scatter Plot

1.3.3.26.7.

Scatter Plot: Sinusoidal Relationship (damped)

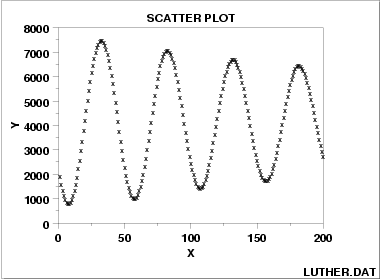
Scatter Plot Showing a Sinusoidal Relationship scatter plot showing a sinusoidal relationship
Discussion The complex relationship between X and Y in this plot of the LUTHER.DAT data set appears to be basically oscillatory, and so one is naturally drawn to the trigonometric sinusoidal model:
    \[ Y_{i} = C + \alpha\sin{(2\pi\omega t_{i} + \phi)} + E_{i} \]
Closer inspection of the scatter plot reveals that the amount of swing (the amplitude α in the model) does not appear to be constant but rather is decreasing (damping) as X gets large. We thus would be led to the conclusion: damped sinusoidal relationship, with the simplest corresponding model being
    \[ Y_{i} = C + (B_0 + B_1*t_{i})\sin{(2\pi\omega t_{i} + \phi)} + E_{i} \]
Home Tools & Aids Search Handbook Previous Page Next Page