1.3. EDA Techniques
1.3.3. Graphical Techniques: Alphabetic
1.3.3.26. Scatter Plot
1.3.3.26.4. |
Scatter Plot: Exact Linear (positive correlation) Relationship |


|
1.
Exploratory Data Analysis
1.3. EDA Techniques 1.3.3. Graphical Techniques: Alphabetic 1.3.3.26. Scatter Plot
|
|||
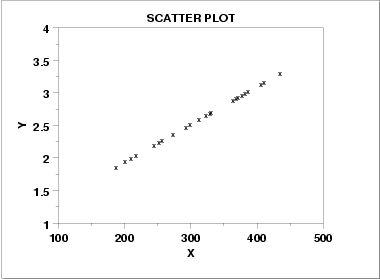
| Scatter Plot Showing an Exact Linear Relationship |

|
||
| Discussion | Note in the plot above how a straight line comfortably fits through the data; hence there is a linear relationship. The scatter about the line is zero--there is perfect predictability between X and Y), so there is an exact linear relationship. The slope of the line is positive (small values of X correspond to small values of Y; large values of X correspond to large values of Y), so there is a positive co-relation (that is, a positive correlation) between X and Y. | ||
