1.3. EDA Techniques
1.3.3. Graphical Techniques: Alphabetic
1.3.3.26. Scatter Plot
1.3.3.26.1. |
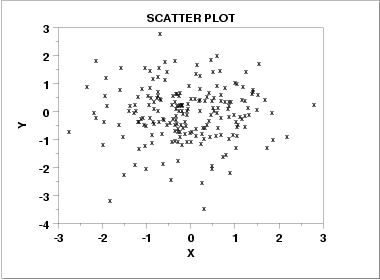
Scatter Plot: No Relationship |

|
1.
Exploratory Data Analysis
1.3. EDA Techniques 1.3.3. Graphical Techniques: Alphabetic 1.3.3.26. Scatter Plot
|
|||
| Scatter Plot with No Relationship |
|
||
| Discussion | Note in the plot above how for a given value of X (say X = 0.5), the corresponding values of Y range all over the place from Y = -2 to Y = +2. The same is true for other values of X. This lack of predictablility in determining Y from a given value of X, and the associated amorphous, non-structured appearance of the scatter plot leads to the summary conclusion: no relationship. | ||
