
|
|
YULPPFName:
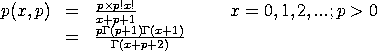
with p denoting the shape parameter and
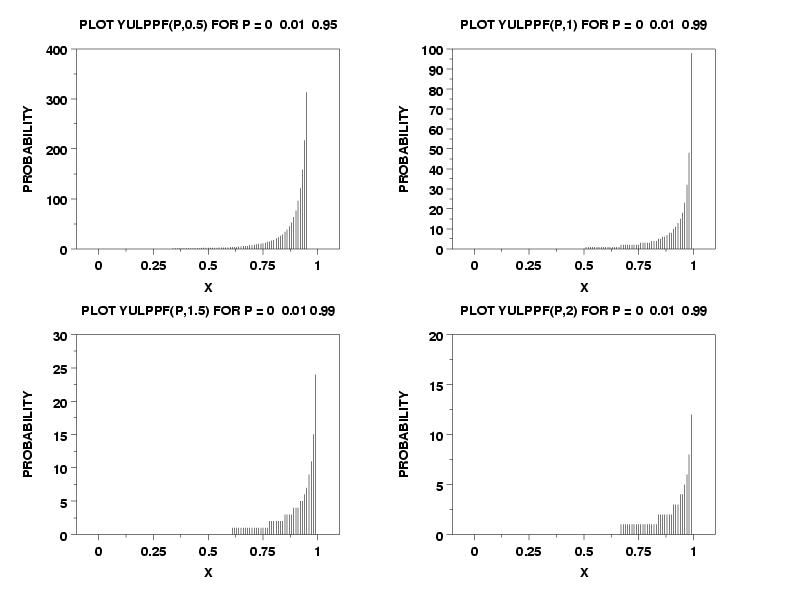
Dataplot computes the Yule probability density function using the log gamma function. The Yule distribution has increasingly long tails as p goes to zero. Currently, Dataplot limits the Yule ppf function to the case where p >= 0.1. The cumulative distribution function is the sum from 0 to x. The percent point function is the inverse of the cumulative distribution function. That is, given the probability, the appropriate value of x is returned. The percent point is determined by computing the terms of the Yule cdf function until the requested probability value is obtained.
where <x> is a non-negative integer number, parameter, or variable in the interval (0,1); <p> is a positive number, parameter, or variable that specifies the shape parameter; <y> is a variable or a parameter (depending on what <x> is) where the computed Yule ppf value is stored; and where the <SUBSET/EXCEPT/FOR qualification> is optional.
LET A = YULPPF(X,P) PLOT YULPPF(X,2) FOR X = 0 0.01 0.95
X1LABEL Probability
Y1LABEL X
LABEL CASE ASIS
X1LABEL DISPLACEMENT 12
Y1LABEL DISPLACEMENT 12
MULTIPLOT 2 2
MULTIPLOT CORNER COORDINATES 0 0 100 100
XTIC OFFSET 0.1 0.1
LINE BLANK
SPIKE ON
TITLE AUTOMATIC
X1LABEL X
Y1LABEL PROBABILITY
TITLE SIZE 3
PLOT YULPPF(P,0.5) FOR P = 0  0.01  0.95
PLOT YULPPF(P,1) FOR P = 0  0.01  0.99
PLOT YULPPF(P,1.5) FOR P = 0  0.01 0.99
PLOT YULPPF(P,2) FOR P = 0  0.01  0.99
END OF MULTIPLOT
Date created: 7/7/2004 |
 denoting the gamma function (HELP GAMMA for details).