
|
|
YFRAMEName:
One minor complication occurs if we have defined a tic mark offset (i.e., the distance from the first or last major tic mark to the end of the frame line. You can use the following command to specify whether you want the tic mark offset included in the returned limits
If you specify OFF, the tic mark offset will not be included. If you specify ON, the tic mark offset will be included. Note that this command does not actually set the frame limits. You can use the values returned by this command in a subsequent YLIMITS command to set the limits. This command returns the limits for the y-axis. The XFRAME command can be used to return the limits for the x-axis.
where <y> is a response variable; <ymin> is a parameter that stores the minimum value for the y-axis frame; <ymax> is a parameter that stores the maximum value for the y-axis frame; and where the <SUBSET/EXCEPT/FOR qualification> is optional.
LET YMIN YMAX = YFRAME Y SUBSET Y > 0
skip 25
read berger1.dat y x
.
set frame limits offset off
let ymin1 ymax1 = yframe y
let xmin1 xmax1 = xframe x
.
set frame limits offset on
tic mark offset units screen
tic mark offset 3 3
let ymin2 ymax2 = yframe y
let xmin2 xmax2 = xframe x
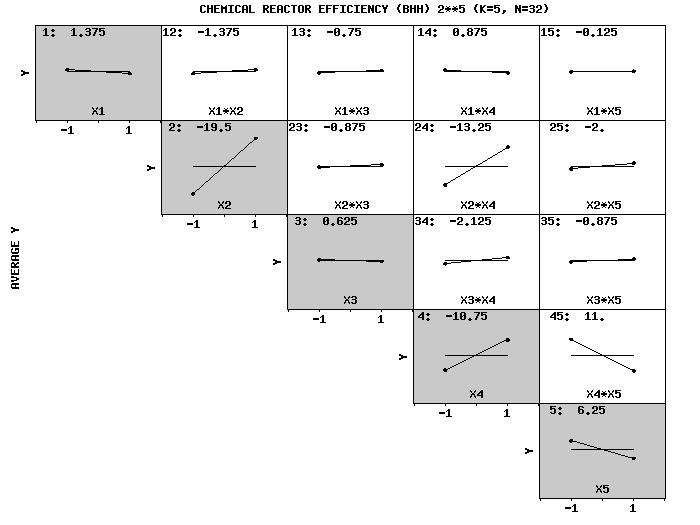
Program 2:
. Purpose:  Demonstrate Interaction Effects Matrix plot using
.           scatter plot matrix commnad.
.
. Step 1:   Read the data
.
skip 25
read boxreact.dat y x1 to x5
let n = size y
let k = 5
let string stat = Mean
. variable label X1 X1 (Feed Rate)
. variable label X2 X2 (Catalyst)
. variable label X3 X3 (Agitation Rate)
. variable label X4 X4 (Temperature)
. variable label X5 X5 (Concentration)
variable label X1 X1
variable label X2 X2
variable label X3 X3
variable label X4 X4
variable label X5 X5
.
. Step 2:   Define plot control settings
.
multiplot corner coordinates 5 5 95 95
multiplot scale factor 3
tic offset units screen
tic offset 5 5
.
xlimits -2  2
major x1tic mark number 5
minor x1tic mark number 0
x1tic mark label format alpha
x1tic mark label content sp() -1 sp() 1 sp()
x1tic marks off
x1tic mark labels off
x1tic mark offset 0.5 0.5
x1label displacement 95
x2label displacement 12
x2label justification left
x2label offset -20
.
probe cpumax
let cpumax = probeval
probe cpumin
let cpumin = probeval
let ymin = cpumax
let ymax = cpumin
loop for k = 1 1 k
    let ytemp = cross tabulate mean y x^k
    let ymint = minimum ytemp
    let ymaxt = maximum ytemp
    let ymin = min(ymint,ymin)
    let ymax = max(ymaxt,ymax)
end of loop
delete ytemp
.
set frame limits offset off
let ytemp = data ymin ymax
let ymin1 ymax1 = yframe ytemp
set frame limits offset on
let ymin2 ymax2 = yframe ytemp
let xtemp = data -2 2
let xmin2 xmax2 = xframe xtemp
delete xtempl ytemp1
ylimits ymin1 ymax1
.
char circle blank
char hw 1 0.75
char fill on
line solid dashed
.
. Step 3:   Define options for scatter plot matrix
.
set scatter plot matrix type dex ^stat interaction
set scatter plot matrix labels xon
set scatter plot matrix y axis left
set scatter plot matrix x axis bottom
set scatter plot matrix lower diagonal off
set scatter plot matrix x2label filliben
set scatter plot matrix shaded diagonal on
subregion on
subregion xlimits xmin2 xmax2
subregion ylimits ymin2 ymax2
region fill on
region color g80
.
. Step 4:   Generate the plot
.
dex mean interaction effects plot y x1 x2 x3 x4 x5
.
. Step 5:   Add overall title, vertical axis title
.
just center
move 50 97
text Chemical Reactor Efficiency (BHH) 2**5 (K=5, N=32)
.
direction vertical
move 3 50
text Average Y
direction horizontal
|
Privacy
Policy/Security Notice
NIST is an agency of the U.S.
Commerce Department.
Date created: 04/11/2016 | ||||