SED navigation bar go to SED home page go to Dataplot home page go to NIST home page SED Home Page SED Staff SED Projects SED Products and Publications Search SED Pages
Dataplot Vol 2 Vol 1

SORT BY STATISTIC (LET)

Name:
    SORT BY STATISTIC (LET)
Type:
    Let Subcommand
Purpose:
    Sort the values of a group variable based on the values of a user-specified statistic for each group.
Description:
    For plots based on a response variable and a corresponding group-id variable, it is often desirable to generate the plot sorted by the value of some statistic for each group. For example, you may want to generate a box plot ordered from the smallest median to the largest median.

    In most cases, the sorting statistic will be a location statistic such as the mean, median, minimum, or maximum. However, Dataplot supports 40+ statistics for the sorting statistic.

    The SORT BY command is a utility command that simplifies the generation of these sorted plots. Specifically, it can be used in conjunction with the following types of plots:

    1. BOX PLOT
    2. <STATISTIC> PLOT
    3. PLOT Y X TAG (i.e., scatter plot with replication)

    Given a response variable, Y, and a group-id variable, X, the SORT BY command computes the value of a specified statistic for each group and returns the following two variables:

    1. An index variable which is the ranking of the computed statistic for each group (if there are five groups in the data, the index variable will have five elements).

    2. A sorted group-id variable, X2, that is used in place of the original X variable in subsequent plots.
Syntax:
    LET <x2> <index> = SORT BY <stat> <y> <x>
                            <SUBSET/EXCEPT/FOR qualification>
    where <y> is the response variable;
                <x> is the group-id variable;
                <stat> is one of the following statistics:
        MEAN, MIDMEAN, MEDIAN, TRIMMED MEAN, WINSORIZED MEAN,
        GEOMETRIC MEAN, HARMONIC MEAN, HODGES LEHMAN,
        BIWEIGHT LOCATION,
        SUM, PRODUCT, SIZE (or NUMBER or SIZE),
        STANDARD DEVIATION, STANDARD DEVIATION OF MEAN,
        VARIANCE, VARIANCE OF THE MEAN,
        TRIMMED MEAN STANDARD ERROR,
        AVERAGE ABSOLUTE DEVIATION (or AAD),
        MEDIAN ABSOLUTE DEVIATION (or MAD),
        IQ RANGE, BIWEIGHT MIDVARIANCE, BIWEIGHT SCALE,
        PERCENTAGE BEND MIDVARIANCE,
        WINSORIZED VARIANCE, WINSORIZED STANDARD DEVIATION,
        RELATIVE STANDARD DEVIATION, RELATIVE VARIANCE,
        COEFFICIENT OF VARIATION,
        RANGE, MIDRANGE, MAXIMUM, MINIMUM, EXTREME,
        LOWER HINGE, UPPER HINGE, LOWER QUARTILE, UPPER QUARTILE,
        <FIRST/SECOND/THIRD/FOURTH/FIFTH/SIXTH/SEVENTH/EIGHTH/
        NINTH/TENTH> DECILE,
        PERCENTILE, QUANTILE, QUANTILE STANDARD ERROR,
        SKEWNESS, KURTOSIS, NORMAL PPCC,
        AUTOCORRELATION, AUTOCOVARIANCE,
        SIN FREQUENCY, SIN AMPLITUDE,
        CP, CPK, CNPK, CPM, CC,
        EXPECTED LOSS, PERCENT DEFECTIVE,
        TAGUCHI SN0 (or SN), TAGUCHI SN+ (or SNL),
        TAGUCHI SN- (or SNS), TAGUCHI SN00 (or SN2);
                <x2> is a variable where the sorted group-id values are stored;
                <index> is a variable where the ranking of the statistic for each group are stored;
    and where the <SUBSET/EXCEPT/FOR qualification> is optional.
Examples:
    LET X2 INDX = SORT BY MEAN Y X
    LET X2 INDX = SORT BY MEIDAN Y X
    LET X2 INDX = SORT BY SD Y X
    LET X2 INDX = SORT BY MINIMUM Y X
    LET X2 INDX = SORT BY IQ RANGE Y X
Note:
    These plots often have alphabetic tick mark labels. The following enhancements were made to simplify the use of alphabetic tick mark labels with sorted plots.

    • The TIC MARK LABEL FORMAT and TIC MARK LABEL CONTENT commands were previously augmented to allow numeric variables, group label variables, or the row label variable as the contents for the tick mark labels. Specifically,

        LET LAB = DATA 50 40 30 20 10 0
        X1TIC MARK LABEL FORMAT VARIABLE
        X1TIC MARK LABEL CONTENT LAB

        LET IG = GROUP LABELS A B C D E
        X1TIC MARK LABEL FORMAT GROUP LABEL
        X1TIC MARK LABEL CONTENT IG

        X1TIC MARK LABEL FROMAT ROW LABELS

      This has been enhanced to allow an index variable to be specified on the above TIC MARK LABEL CONTENT commands (the index variable is typically generated by a SORT BY <stat> command). The index variable specifies the order in which the tick mark labels will be generated.

      So the above examples can be augmented by

        LET X2 INDX = SORT BY MEAN Y X
        LET LAB = DATA 50 40 30 20 10 0
        X1TIC MARK LABEL FORMAT VARIABLE
        X1TIC MARK LABEL CONTENT LAB INDX

        LET X2 INDX = SORT BY MEAN Y X
        LET IG = GROUP LABELS A B C D E
        X1TIC MARK LABEL FORMAT GROUP LABEL
        X1TIC MARK LABEL CONTENT IG INDX

        LET X2 INDX = SORT BY MEAN Y X
        X1TIC MARK LABEL FROMAT ROW LABELS
        X1TIC MARK LABEL CONTENT INDX

      Note that it is the values of INDX when the plot is generated, not when the TIC MARK LABEL CONTENT is entered, that will be used to sort the tick mark labels.

    • The LET ... = GROUP LABEL .... command was augmented in the following two ways.

      1. You can specify literal strings for group labels. For example,

          LET IG = GROUP LABEL BATCHSP()1 BATCHSP()2 ...
          BATCHSP()3 BATCHSP()4

        The strings are separated by spaces. If you need to include a space in a particular string, use the SP() as in the above example.

      2. Pre-defined strings can be used to define a group label variable. For example,

          LET IG = GROUP LABEL ST1 TO ST10

        where ST1, ST2, ...., ST10 are previously defined strings. The TO syntax is useful in this context when the number of strings is large.

      Dataplot's algorithm for parsing the GROUP LABEL command is:

      1. Dataplot first checks the character variables file (HELP SET CONVERT CHARACTER for details). If the first name listed is found, Dataplot uses this character variable to define the group labels.

      2. If a character variable is not found, Dataplot checks all the listed names to see if they are previously defined strings. If they are, then Dataplot substitutes the values of these strings.

      3. If one or more of the names is not a previously defined string, then Dataplot treats all of the names as literal text strings.
Default:
    None
Synonyms:
    None
Related Commands: Applications:
    Data Analysis
Implementation Date:
    2006/1: Original Implementation
Program 1:
     
    skip 25
    read splett2.dat y x
    .
    let x2 indx = sort by median y x
    let ig = group label Tinius1 Tinius2 Satec Tokyo
    x1tic mark label case asis
    x1tic mark label format group labels
    x1tic mark label content ig indx
    .
    char box plot
    line box plot
    fences on
    .
    xlimits 1 4
    major xtic mark number 4
    minor xtic mark number 0
    xtic offset 0.5 0.5
    .
    title case asis
    title offset 2
    title Charpy V-NIST Notch Testing
    label case asis
    x1label Machine Manufacturer
    y1label Absorbed Energy
    .
    box plot y x2
        

    plot generated by sample program

Program 2:
     
    set convert character on
    skip 25
    read draft69c.dat rank day month
    .
    let ig = group label month
    x1tic mark label format group label
    let xcode = character code month
    .
    major xtic mark number 12
    minor xtic mark number 0
    xlimits 1 12
    xtic offset 0.5 0.5
    .
    let xcode2 indx = sort by mean rank xcode
    x1tic mark label content ig  indx
    .
    x1tic mark label size 1.5
    tic mark label case asis
    label case asis
    title case asis
    title displacement 2
    x1label Month
    y1label Draft Ranking
    title Mean Plot Ordered by Mean
    .
    mean plot rank xcode2
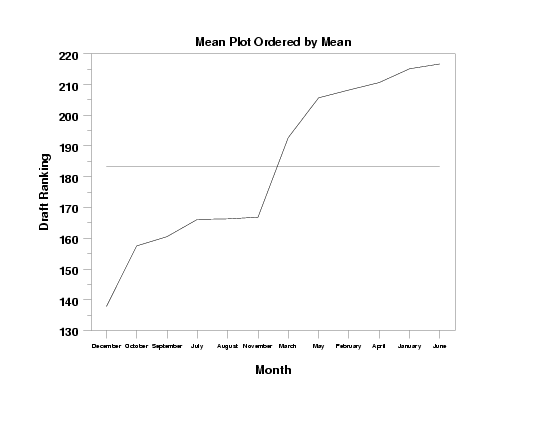
        
    plot generated by sample program
Program 3:
     
    skip 25
    read splett2.dat y x
    .
    let ig = group label Tinius1 Tinius2 Satec Tokyo
    .
    char x blank
    line blank dash
    .
    xlimits 1 4
    major xtic mark number 4
    minor xtic mark number 0
    tic offset units screen
    tic offset 5 5
    .
    title offset 2
    multiplot corner coordinates 0 0 100 100
    multiplot 2 2
    multiplot scale factor 2
    .
    x1tic mark label format group label
    x1tic mark label content ig
    title Mean Plot (Unsorted)
    mean plot y x
    .
    title SD Plot (Unsorted)
    sd plot y x
    .
    title Mean Plot (Sorted by Mean)
    let x2 indx = sort by mean y x
    x1tic mark label content ig indx
    mean plot y x2
    .
    title SD Plot (Sorted by SD)
    let x2 indx = sort by sd y x
    x1tic mark label content ig indx
    sd plot y x2
    .
    end of multiplot
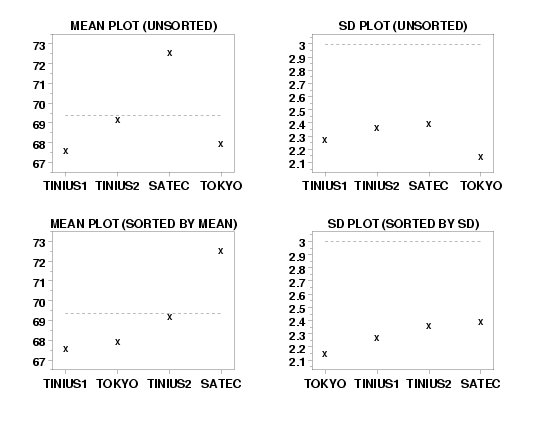
        
    plot generated by sample program
Program 4:
     
    skip 25
    read gear.dat y x
    .
    char x all
    line solid all
    .
    xlimits 1 10
    major xtic mark number 10
    minor xtic mark number 0
    xtic offset 0.5 0.5
    .
    title offset 2
    multiplot corner coordinates 0 0 100 100
    multiplot 2 2
    multiplot scale factor 2
    .
    title Original Data
    plot y x x
    .
    title Sort by Mean
    let x2 indx = sort by mean y x
    x1tic mark label format variable
    x1tic mark label content indx
    plot y x2 x2
    .
    title Sort by Minimum
    let x2 indx = sort by minimum y x
    x1tic mark label content indx
    plot y x2 x2
    .
    title Sort by SD
    let x2 indx = sort by sd y x
    x1tic mark label content indx
    plot y x2 x2
    .
    end of multiplot
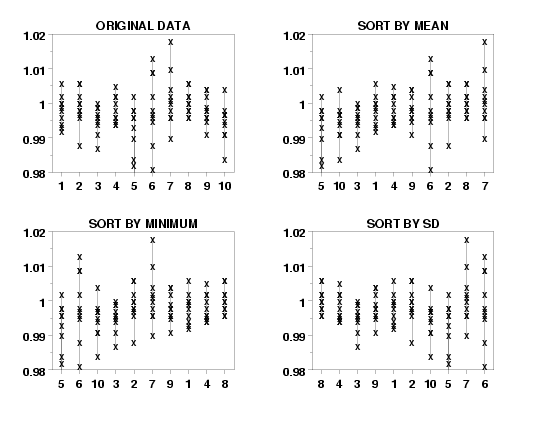
        
    plot generated by sample program

Date created: 1/26/2006
Last updated: 1/26/2006
Please email comments on this WWW page to alan.heckert@nist.gov.