
|
|
SAMPLE RANDOM PERMUTATIONName:
This SAMPLE RANDOM PERMUTATION command was motivated by the desire to simulate the following problem. Given a worm that has infected a single computer, simulate the following:
This process will be repated until all IP addresses corresponding to valid machines are infected. The Program 1 example demonstrates how this simulation can be implemented using the SAMPLE RANDOM PERMUTATION command.
<npop> <nkeep> <p> <niter> where <npop> is a number or parameter that specifies the size of the random permutation; <nkeep> is a number of parameter that specifies how many permutated values are kept at each step; <p> is a parameter or number (greater than 0 and less than or equal to 1) that specifies the proportion of valid permutation values; <niter> is a number of parameter (less than or equal to <npop>) that specifies how many sets of randon permutations are generated; <y> is a variable where the permutated values are saved; <tag> is a variable that identifies which iteration generated the permuted values.
This is demonstrated in the Program 2 and Program 3 examples below.
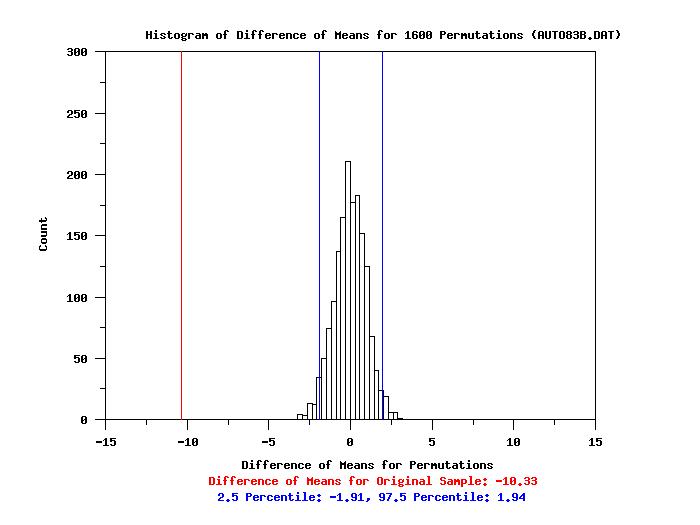
Specifically, it can be used to efficiently implement two sample permutation tests. The Program 2 and Program 3 examples below demonstrate a two sample permutation test for the difference between the means of two samples. These examples can be easily adapted to test for the difference between other location statistics such as the median or the trimmed mean. Based on extensive simulation studies, Higgins recommends that 1,600 random permutations should be sufficient for most purposes.
Knoble RANDPERM algorithm downloaded from: http://coding.derkeiler.com/Archive/Fortran/comp.lang.fortran/2006-03/msg00748.html. Higgins (2004), "Introduction to Modern Nonparametric Statistics", Duxbury Press, Chapter 2.
set random number generator fibbonacci congruential
seed 56791
.
let npop  = 64000
let nkeep = 10
let p     = 0.25
let maxiter = 20
let maxit2  = 19
let nmax = p*npop
.
let y(1) = 1
let nyv(1) = 1
let y = 0 for i = 2 1 maxiter
let iterv = sequence 0 1 maxit2
.
loop for k = 1 1 maxiter
    let niter = size y
    let ynew tag = sample random permutation npop nkeep p niter
    let ny = size y
    let nyv(k) = ny
    let y = combine y ynew
    let y = distinct y
    if ny >= nmax
       break loop
    end of if
end of loop
.
set write decimals 0
print iterv nyv
The following output is generated
------------------------------
          ITERV            NYV
------------------------------
              0             20
              1             50
              2            181
              3            623
              4           2040
              5           5860
              6          11932
              7          15351
              8          15941
              9          15995
             10          16000
             11              0
             12              0
             13              0
             14              0
             15              0
             16              0
             17              0
             18              0
             19              0
Program 2:
set random number generator fibbonacci congruential
seed 32119
.
.           Read the data
.
dimension 15 columns
.
skip 25
read auto83b.dat y1 y2
retain y2 subset y2 >= 0
let y = comb y1 y2
let n1 = size y1
let n2 = size y2
skip 0
.
.           Compute the statistic for the original sample
.
let mean1 = mean y1
let mean2 = mean y2
let statval = mean1 - mean2
.
.           Generate the random permutations
.
let npop  = n1 + n2
let nkeep = npop
let p     = 1
let niter = 1600
let ntot = npop*niter
let repeat = data n1 n2
let val = data 1 2
let tag2 = sequence val repeat for i = 1 1 ntot
set sample random permutation distinct off
.
let yindx tag1 = sample random permutation npop nkeep p niter
let ynew = gather y yindx
.
.           Now compute the statistic for the permutations
.
set let cross tabulate collapse
let ynew2 = ynew
let tag12 = tag1
retain ynew2 tag12 subset tag2 = 1
let ym1 = cross tabulate mean ynew2 tag12
let ynew2 = ynew
let tag12 = tag1
retain ynew2 tag12 subset tag2 = 2
let ym2 = cross tabulate mean ynew2 tag12
let ydiff = ym1 - ym2
.
.           Now plot the results of the permutation test
.
let xq = 0.025
let low025 = quantile ydiff
let low025 = round(low025,2)
let xq = 0.975
let upp975 = quantile ydiff
let upp975 = round(upp975,2)
.
let xq = 0.025
let low025 = quantile ydiff
let low025 = round(low025,2)
let xq = 0.975
let upp975 = quantile ydiff
let upp975 = round(upp975,2)
.
title offset 2
title case asis
label case asis
y1label Count
x1label Difference of Means for Permutations
let statval = round(statval,2)
x2label color red
x2label Difference of Means for Original Sample: ^statval
x3label color blue
x3label 2.5 Percentile: ^low025, 97.5 Percentile: ^upp975
xlimits -15 15
title Histogram of Difference of Means for ^niter Permutations (AUTO83B.DAT)
.
histogram ydiff
.
line color red
line dash
drawdsds statval 20 statval 90
line color blue
line dash
drawdsds low025 20 low025 90
drawdsds upp975 20 upp975 90
 Program 3:
set random number generator fibbonacci congruential
seed 32119
.
. Read the data
.
dimension 15 columns
.
let y1 = norm rand numb for i = 1 1 200
let y2 = norm rand numb for i = 1 1 80
let y2 = y2 + 0.1
let y = comb y1 y2
let n1 = size y1
let n2 = size y2
skip 0
.
. Generate the random permutations
.
let mean1 = mean y1
let mean2 = mean y2
let statval = mean1 - mean2
.
let npop = n1 + n2
let nkeep = npop
let p = 1
let niter = 1600
let ntot = npop*niter
let repeat = data n1 n2
let val = data 1 2
let tag2 = sequence val repeat for i = 1 1 ntot
set sample random permutation distinct off
.
let yindx tag1 = sample random permutation npop nkeep p niter
let ynew = gather y yindx
.
. Now compute the statistic for the permutations
.
set let cross tabulate collapse
let ynew2 = ynew
let tag12 = tag1
retain ynew2 tag12 subset tag2 = 1
let ym1 = cross tabulate mean ynew2 tag12
let ynew2 = ynew
let tag12 = tag1
retain ynew2 tag12 subset tag2 = 2
let ym2 = cross tabulate mean ynew2 tag12
let ydiff = ym1 - ym2
.
. Now plot the results of the permutation test
.
let xq = 0.025
let low025 = quantile ydiff
let low025 = round(low025,2)
let xq = 0.975
let upp975 = quantile ydiff
let upp975 = round(upp975,2)
.
title offset 2
title case asis
label case asis
y1label Count
x1label Difference of Means for Permutations
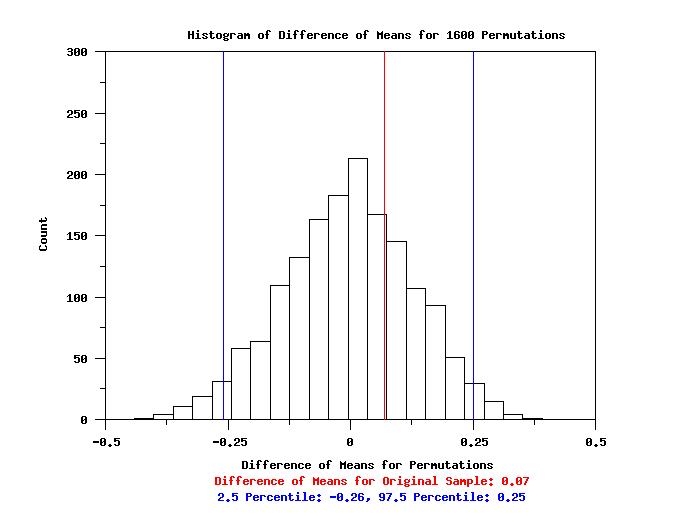
let statval = round(statval,2)
x2label color red
x2label Difference of Means for Original Sample: ^statval
x3label color blue
x3label 2.5 Percentile: ^low025, 97.5 Percentile: ^upp975
xlimits -0.5 0.5
title Histogram of Difference of Means for ^niter Permutations
.
histogram ydiff
.
line color red
line dash
drawdsds statval 20 statval 90
line color blue
line dash
drawdsds low025 20 low025 90
drawdsds upp975 20 upp975 90
|
Privacy
Policy/Security Notice
NIST is an agency of the U.S.
Commerce Department.
Date created: 08/15/2017 | ||||||||||||||||||||||