
|
PNRPPFName:

where p is the shape (power) parameter and
If p is 1, this distribution reduces to the normal distribution.
where <y1> is a number, parameter, or variable in the range 0 to 1; <p> is a positive number, parameter, or variable that specifies the power parameter; <y2> is a variable or a parameter (depending on what <y1> is) where the computed power-normal ppf value is stored; and where the <SUBSET/EXCEPT/FOR qualification> is optional.
LET X2 = PNRPPF(X1,P) LET X2 = PNRPPF(X1,0.5)

where
LABEL CASE ASIS
X1LABEL Probabiulity
Y1LABEL X
YLIMITS -5 10
TITLE CASE ASIS
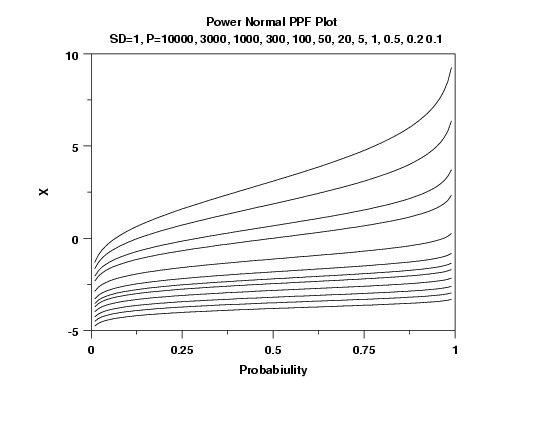
TITLE Power Normal PPF Plot CR() ...
 SD=1, P=10000, 3000, 1000, 300, 100, 50, 20, 5, 1, 0.5, 0.2 0.1
.
PLOT PNRPPF(F,10000) FOR F = 0.01 0.01 0.99 AND
PLOT PNRPPF(F,3000) FOR F = 0.01 0.01 0.99 AND
PLOT PNRPPF(F,1000) FOR F = 0.01 0.01 0.99 AND
PLOT PNRPPF(F,300) FOR F = 0.01 0.01 0.99 AND
PLOT PNRPPF(F,100) FOR F = 0.01 0.01 0.99 AND
PLOT PNRPPF(F,50) FOR F = 0.01 0.01 0.99 AND
PLOT PNRPPF(F,20) FOR F = 0.01 0.01 0.99 AND
PLOT PNRPPF(F,5) FOR F = 0.01 0.01 0.99 AND
PLOT PNRPPF(F,1) FOR F = 0.01 0.01 0.99 AND
PLOT PNRPPF(F,0.5) FOR F = 0.01 0.01 0.99 AND
PLOT PNRPPF(F,0.2) FOR F = 0.01 0.01 0.99 AND
PLOT PNRPPF(F,0.1) FOR F = 0.01 0.01 0.99

Date created: 11/13/2002 |