
|
|
PARTIAL CORRELATION MATRIXName:
The algorithm for computing the partial correlations is:
Alternatively, you can compute the CDF or the p-value for the partial correlation coefficients (i.e., to see if the partial correlation coefficient is significantly different than zero). The CDF value is
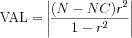
where FCDF is the F cumulative distribution function with 1 and N - NC degrees of freedom (N is the number of observations and NC is the number of columns in the input matrix) and
with r denoting the computed partial correlation. The pvalue is 1 - CDF.
<SUBSET/EXCEPT/FOR qualification> where <mat1> is a matrix for which the partial correlations are to be computed; <mat2> is a matrix where the resulting partial correlations are saved; and where the <SUBSET/EXCEPT/FOR qualification> is optional and rarely used in this context.
<SUBSET/EXCEPT/FOR qualification> where <mat1> is a matrix for which the partial correlation CDF's are to be computed; <mat2> is a matrix where the resulting partial correlation CDF's are saved; and where the <SUBSET/EXCEPT/FOR qualification> is optional and rarely used in this context. This syntax computes the CDF's of the partial correlation coefficients.
<SUBSET/EXCEPT/FOR qualification> where <mat1> is a matrix for which the partial correlation p-value's are to be computed; <mat2> is a matrix where the resulting partial correlation p-values's are saved; and where the <SUBSET/EXCEPT/FOR qualification> is optional and rarely used in this context. This syntax computes the p-values of the partial correlation coefficients.
To specify a partial correlation matrix based on rows rather than columns, enter the command
To reset column based partial correlations, enter
BIWEIGHT MIDCORRELATION/PERCENTAGE BEND/ KENDALL TAU> To see the definitions for these, enter
.  This data is from page 202 of
.
.  Peavy, Bremer, Varner, Hogben (1986), "OMNITAB 80:
.  An Interpretive System for Statistical and Numerical
.  Data Analysis," NBS Special Publication 701.
.
.  Original source of the data is from
.  Draper and Smith (1981), "Applied Regression Analysis",
.  Wiley, p. 373.
.
dimension 40 columns
.
read matrix m
42.2  11.2  31.9  167.1
48.6  10.6  13.2  174.4
42.6  10.6  28.7  160.8
39.0  10.4  26.1  162.0
34.7   9.3  30.1  140.8
44.5  10.8   8.5  174.6
39.1  10.7  24.3  163.7
40.1  10.0  18.6  174.5
45.9  12.0  20.4  185.7
end of data
.
set write decimals 4
let pcorr = partial correlation matrix m
print pcorr
The following output is generated.
        MATRIX PCORR   --            4 ROWS
                       --            4 COLUMNS

 VARIABLES--PCORR1         PCORR2         PCORR3         PCORR4

         1.0000         0.4317        -0.4566         0.1054
         0.4317         1.0000         0.6972         0.7268
        -0.4566         0.6972         1.0000        -0.6478
         0.1054         0.7268        -0.6478         1.0000
Date created: 01/23/2013 |
