
|
TRILINEAR PLOTName:
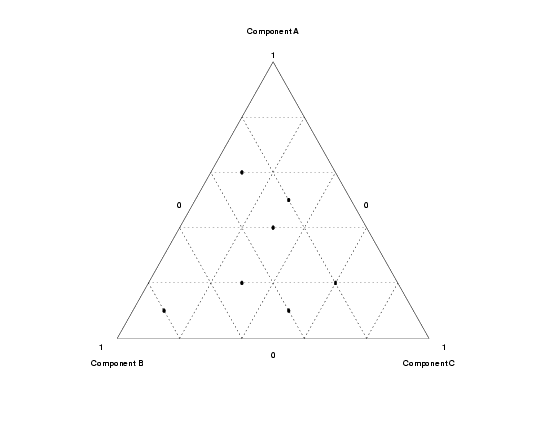
The plot frame is an equilateral triangle. The plot coordinates for point (x1,x2,x3) is determined by drawing a line from each vertex to the opposite side of the triangle such that the line is perpindicular to the opposite side. The intersection of these 3 lines defines the plot point. In Dataplot,
<SUBSET/EXCEPT/FOR qualification> where <y1> is a variable containing the values for the first component; <y2> is a variable containing the values for the second component; <y3> is a variable containing the values for the third component; and where the <SUBSET/EXCEPT/FOR qualification> is optional. In this syntax, there is a single curve.
<SUBSET/EXCEPT/FOR qualification> where <y1> is a variable containing the values for the first component; <y2> is a variable containing the values for the second component; <y3> is a variable containing the values for the third component; <groupid> is a group-id variable; and where the <SUBSET/EXCEPT/FOR qualification> is optional. This syntax is used for the case where there are multiple curves on the same plot.
TRILINEAR PLOT Y1 X1 Z1 TRILINEAR PLOT Y1 X1 Z1 BATCH
Axis labels are not generated. You can use the LEGEND command to add labels if desired. See the Program section below for an example.
read y1 y2 y3
0.2 0.5 0.3
0.3 0.6 0.1
0.4 0.1 0.5
0.5 0.2 0.3
0.2 0.2 0.6
0.3 0.4 0.3
0.8 0.1 0.1
end of data
.
let n = size y1
char circ
line blank all
char size 1 all
char fill on all
xlimits 0 1
major x1tic mark number 6
grid on
grid pattern dotted
x1tic marks on
x1tic mark labels on
.
frame corner coordinates 20 18 80 88
.
legend case asis
legend justification center
legend 1 Component A
legend 2 Component B
legend 3 Component C
legend 1 coordinates 50 95
legend 2 coordinates 20 11
legend 3 coordinates 80 11
.
trilinear plot y1 y2 y3

Date created: 01/07/2008 |
Last updated: 12/04/2023 Please email comments on this WWW page to [email protected]. | ||||||||||