|
|
RECIPEName:
The development of RECIPE was motivated for use in determining design allowables for composite materials in aircraft applications, particularly in the prescence of between-batch variability. Note that an A-basis value is a (0.99,0.95) lower tolerance limit and a B-basis value is a (0.90,0.95) lower tolerance limit. Alternatively A- and B-basis values can be interpreted to be 95% lower confidence bounds on the 1st and 10th population percentiles respectively. In Dataplot, the A BASIS and B BASIS commands can be used to compute A-basis and B-basis values for univariate data for normal, lognormal, and Weibull distributions. RECIPE is used to calculate basis values for regression models with or without a random batch effect. This methodology was developed by NIST statistician Mark Vangel as part of his involvement with MIL-HDBK-17E (or MIL-17 Handbook). Dataplot adapted source code provided by Mark Vangel to implement this command within Dataplot. More formally, let
denote a mixed model with two components of variance. The
fixed part of the model is
The above is only a brief outline of RECIPE. A complete discussion of this methodolgy is available at the following web site (including the original Fortran source code):
These web pages discuss both the mathematical model for RECIPE and its application to real problems. Additional discussion is contained in the papers listed in the Reference section. The example programs below give some typical applications of RECIPE. Note that the input model for the original Fortran implementation of RECIPE is different than the Dataplot implementation. RECIPE is typically preceeded by a regression or ANOVA analysis. RECIPE is then typically applied to the final regression or ANOVA model. RECIPE supports the following types of models:
RECIPE is generally used in the context of the MIL-17 Handbook standards for obtaining A- and B-basis material property values. The primary output from the RECIPE command is a set of tolerance values.
<SUBSET/EXCEPT/FOR qualification> where <y> is the response (= dependent) variable; <x> is the independent variable; <batch> is a batch identifier variable; <xpred> is a variable containing the points at which the tolerances are calculated; and where the <SUBSET/EXCEPT/FOR qualification> is optional. This syntax is used for linear regression and polynomial models. The degree of the fit can be specified by entering the following command before the RECIPE FIT command: RECIPE FIT DEGREE <N> where <N> is a positive integer that specifies the degree polynomial to fit (usually 1 or 2, but higher degrees are allowed). If the RECIPE FIT DEGREE command is not entered, a linear fit is assumed.
<SUBSET/EXCEPT/FOR qualification> where <y> is the response (= dependent) variable; <x1 ... xk> is a list of one or more independent variables; <batch> is a batch identifier variable; <xpred1 ... xpredk> is a list of one or more variables containing the points at which the tolerances are calculated; and where the <SUBSET/EXCEPT/FOR qualification> is optional. This syntax is used for the multilinear regression case.
<SUBSET/EXCEPT/FOR qualification> where <y> is the response (= dependent) variable; <x1> ... <xk> are the k independent variables; <batch> is a batch identifier variable; and where the <SUBSET/EXCEPT/FOR qualification> is optional. This syntax is used for multilinear and ANOVA models. The <batch> variable is optional. To specify whether or not the last variable is a batch variable or one of the factor variables, enter the following command: RECIPE FACTORS <N> where <N> is a positive integer that specifies the number of factor (indpendent) variables on the RECIPE ANOVA command.
RECIPE ANOVA Y X BATCH SUBSET BATCH = 1 TO 3
RECIPE FIT Y X BATCH X2
To change the confidence interval calculated, enter
where <val> defines the desired confidence. Typical values are 0.95, 0.90, or 0.99. To change the coverage interval, enter
where <val> defines the desired coverage. Typical values are 0.90 and 0.99.
where <varname> is the desired variable name. Note that after the RECIPE FIT or RECIPE ANOVA command, this variable can be used like any other Dataplot variable.
 , or equivalently, to
the intraclass correlation , or equivalently, to
the intraclass correlation

The intraclass correlation is the correlation between observations from the same batch.
The nuisance parameter
In order to determine how close the actual and nominal confidence levels are, it is necessary to simulate. The following commands
RECIPE SIMCOV ANOVA correspond to the RECIPE FIT and RECIPE ANOVA commands and can be used to simulate the actual confidence. The RECIPE SIMCOV commands have the same syntax as the RECIPE commands.
The output from the RECIPE SIMCOV commands is a column of
values for
If the actual confidence levels differ too substantially
from the nominal levels, this indicates that a
Satterthwaite approximation used by RECIPE is not
adequate and can be improved upon by replacing the
Satterthwaite approximation with the appropriate quantile
of a simulated pivotal random variable. By doing this,
one can obtain an actual confidence level that is nearly
exact for
If the RECIPE SIMCOV command shows that the Satterthwaite approximation is not adequate, enter the following command to use simulated pivotal values instead:
To restore the use of Satterthwaite approximation, enter
To control the number of correlation values at which to compute SIMCOV probabilites, enter
where <n> is the desired number of values. The default is 11 (that is, p = 0, 0.1, 0.2, 0.3, ... , 0.9 1.0). To control the number of replicates used in computing the SIMCOV confidence levels, enter
where <n> is the number of replicates. The default is 10,000. If Satterthwaite approximation is turned off (and simulated pivotal values are used instead), the number of replicates used in computing the simulated pivotal values can be specified by entering the command
where
"A User's Guide to RECIPE: A FORTRAN Program for Determining One-Sided Tolerance Limits for Mixed Models With Two Components of Variance Version 1.0", Mark Vangel, unpublished document available online at http://www.itl.nist.gov/div898/software/recipe/recidoc.pdf. "New Methods for One-Sided Tolerance Limits for a One-Way Balanced Random Effects ANOVA Model", Mark Vangel, Technometrics, Vol. 34, 1992, pp. 176-185. "One-Sided B-Content Tolerance Limits for Mixed Models with Two Components of Variance", Mark Vangel, Technometrics, submitted. "Design Allowables From Regression Models Using Data From Several Batches", Mark Vangel, 12th Symposium on Composite Materials: Testing and Design, American Society of Testing and Materials, 1996.
. LIST VANGEL31.DP . RECIPE Tolerance Limits Analysis of Graphite/Epoxy Tape Strength . Univariate Case . ------------------------ . Step 1--Read in the data . skip 25 read vangel31.dat y . ------------------------------------------------ . Step 6--Compute (recipe/normal) tolerance limits . recipe content 90 recipe confidence 95 recipe factors 1 let n = size y let x = 1 for i = 1 1 n let b = 1 for i = 1 1 n recipe anova y x b . let tol1 = tol(1) relative histogram y drawdata tol1 0 tol1 +.01
       **************************
       **  recipe anova y x b  **
       **************************


  REGINI : WARNING: BETWEEN-BATCH VARIANCE CANNOT
           BE ESTIMATED FROM THESE DATA. RESULTS
           WILL BE BASED ON THE ASSUMPTION THAT THE
           BETWEEN-BATCH VARIABILITY IS NEGLIGIBLE.


                     RECIPE ANALYSIS
                   (MARK VANGEL, NIST)

 NUMBER OF OBSERVATIONS         =       38
 NUMBER OF UNIQUE DESIGN POINTS =        1
 NUMBER OF BATCHES              =        1

 MODEL: ANOVA
 RESSD FROM THE FITTED MODEL    =   0.3057080E+01
 RESDF FROM THE FITTED MODEL    =        37.

 PROBABILITY CONTENT            =   90.00000%
 PROBABILITY CONFIDENCE         =   95.00000%
 SATTERTHWAITE APPROXIMATION USED


 TOLERANCE VALUES STORED IN VARIABLE TOL
 RESIDUALS        STORED IN VARIABLE RES
 PREDICTED VALUES STORED IN VARIABLE PRED
Program 2:
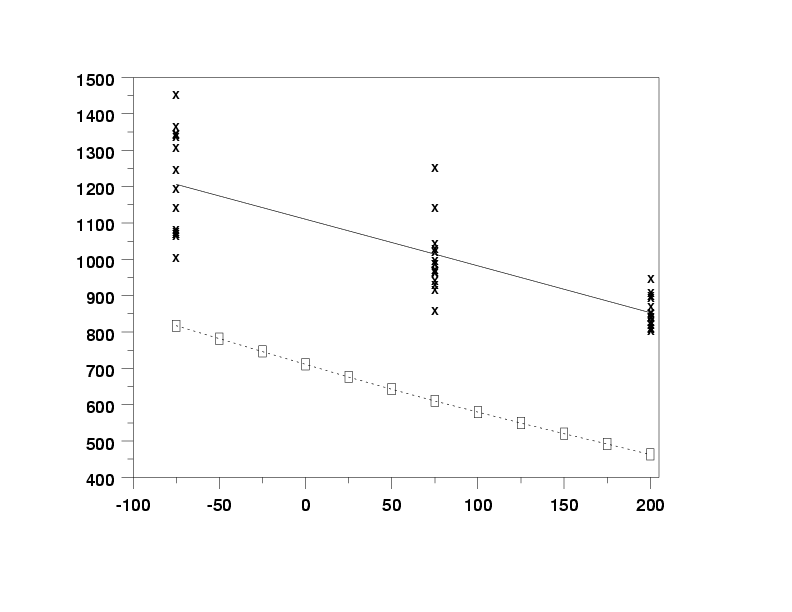
. LIST VANGEL32.DP . RECIPE Tolerance Limits Analysis of Graphite/Epoxy Tape Strength . Regression Case . Date--September 1997 . . ------------------------ . Step 1--Read in the data . skip 25 read vangel32.dat y x b . . ------------------------------------------------ . Step 6--Compute (recipe/normal) tolerance limits . recipe content 90 recipe confidence 95 recipe degree 1 let x2 = sequence -75 25 200 recipe fit y x b x2 . characters x blank box lines blank solid dotted plot y pred versus x and plot tol versus x2
       ***************************
       **  recipe fit y x b x2  **
       ***************************


                     RECIPE ANALYSIS
                   (MARK VANGEL, NIST)

 NUMBER OF OBSERVATIONS         =       45
 NUMBER OF UNIQUE DESIGN POINTS =        3
 NUMBER OF BATCHES              =        3

 MODEL: LINEAR FIT
 RESSD FROM THE FITTED MODEL    =   0.1537953E+02
 RESDF FROM THE FITTED MODEL    =        43.

 PROBABILITY CONTENT            =   90.00000%
 PROBABILITY CONFIDENCE         =   95.00000%
 SATTERTHWAITE APPROXIMATION USED


 TOLERANCE VALUES STORED IN VARIABLE TOL
 RESIDUALS        STORED IN VARIABLE RES
 PREDICTED VALUES STORED IN VARIABLE PRED
Program 3:
. LIST VANGEL33.DP . RECIPE Tolerance Limits Analysis of Graphite/Epoxy Fabric Strength . ANOVA Case . Date--September 1997 . . ------------------------ . Step 1--Read in the data . skip 25 read vangel33.dat y x b . . ------------------------------------------------ . Step 6--Compute (recipe/normal) tolerance limits . recipe content 90 recipe confidence 95 recipe factors 1 recipe anova y x b . characters x blank box lines blank blank blank xtic offset 0.3 0.3 major xtic mark number 2 minor xtic mark number 0 plot y pred versus x and plot tol versus x
       **************************
       **  recipe anova y x b  **
       **************************


                     RECIPE ANALYSIS
                   (MARK VANGEL, NIST)

 NUMBER OF OBSERVATIONS         =       30
 NUMBER OF UNIQUE DESIGN POINTS =        2
 NUMBER OF BATCHES              =        3

 MODEL: ANOVA
 RESSD FROM THE FITTED MODEL    =   0.8579769E+00
 RESDF FROM THE FITTED MODEL    =        28.

 PROBABILITY CONTENT            =   90.00000%
 PROBABILITY CONFIDENCE         =   95.00000%
 SATTERTHWAITE APPROXIMATION USED


 TOLERANCE VALUES STORED IN VARIABLE TOL
 RESIDUALS        STORED IN VARIABLE RES
 PREDICTED VALUES STORED IN VARIABLE PRED
Date created: 06/05/2001 |
Last updated: 12/11/2023 Please email comments on this WWW page to [email protected]. | ||||||||||||||||||
 , where
X is an nxr known matrix having l <= n distinct rows, and
, where
X is an nxr known matrix having l <= n distinct rows, and
 is an
unkown rXl vector. The random part is Z*b + e where Z
is an nxm known matrix of zeros and ones, b follows a normal
distribution with mean zero and standard deviation
is an
unkown rXl vector. The random part is Z*b + e where Z
is an nxm known matrix of zeros and ones, b follows a normal
distribution with mean zero and standard deviation
 , and e follows a normal distribution
with mean zero and standard deviation
, and e follows a normal distribution
with mean zero and standard deviation
 . Let w be an arbitrary rx1 vector, and
assume
. Let w be an arbitrary rx1 vector, and
assume
 ,
,
 ,
and
,
and
 are estimable. RECIPE uses y to obtain approximate one-sided
beta-content tolerance intervals for the population
U where U follows a normal distribution with mean
are estimable. RECIPE uses y to obtain approximate one-sided
beta-content tolerance intervals for the population
U where U follows a normal distribution with mean
 .
.
 is unknown
and typically the number of batches is too small to even
estimate it well. We would like to have a tolerance limit
procedure for which the actual confidence interval equals the
nominal level, whatever
is unknown
and typically the number of batches is too small to even
estimate it well. We would like to have a tolerance limit
procedure for which the actual confidence interval equals the
nominal level, whatever