
|
|
MEAN SUCCESSIVE DIFFERENCES TESTName:
The numerator term is a measure of variance adjusted for trend while the denominator is the standard variance. For N > 20, Dataplot computes critical values based on the following formula from Dixon:
T is compared to a standard normal distribution. For N ≤ 20, critical values are taken from tables given by Neubauer. If the data are random and from an underlying normal distribution, the average value of M is 2. Large values of M indicate excessive fluctuations in the data. Small values of M indicate long term trend. There are several variations of this test in the literature. For example, the numerator term is sometimes given as an absolute value rather than a square. Early versions of the test used N rather than N - 1 in the denominator. There are also been a number of different approximations proposed for the critical values for this test. The approximation used here should be adequate for practical purposes.
The Durbin Watson test is a variant of this test that is commonly
used to test for serial correlation in regression problems. The
mean successive differences test is applied to the residuals. Since
the mean of the residuals is zero, the
This test is also sometimes referred to as the adjacency test.
<SUBSET/EXCEPT/FOR qualification> where <y> is a response variable; and where the <SUBSET/EXCEPT/FOR qualification> is optional.
<SUBSET/EXCEPT/FOR qualification> where <y1> ... <yk> is a list of 1 to 30 response variables; and where the <SUBSET/EXCEPT/FOR qualification> is optional. This syntax will perform a mean successive differences test for each of the response variables. For example,
is equivalent to
MEAN SUCCESSIVE DIFFERENCES TEST Y2 MEAN SUCCESSIVE DIFFERENCES TEST Y3 MEAN SUCCESSIVE DIFFERENCES TEST Y4
<SUBSET/EXCEPT/FOR qualification> where <y> is a response variable; <x1> ... <xk> is a list of 1 to 6 group-id variables; and where the <SUBSET/EXCEPT/FOR qualification> is optional. This syntax will compute the test for each unique combination of the group-id variables.
MEAN SUCCESSIVE DIFFERENCES TEST Y1 TO Y5 REPLICATED MEAN SUCCESSIVE DIFFERENCES TEST Y X1 X2
For N ≤ 20, critical values are obtained from tabulated values and some of these parameters are not defined. In this case, these parameters will be set to the minimum machine value. You can retrieve this value with the commands
LET CPUMIN = PROBVEVAL
LET A = MEAN SUCCESSIVE DIFFERENCES TEST NORMALIZED Y LET A = MEAN SUCCESSIVE DIFFERENCES TEST CDF Y LET A = MEAN SUCCESSIVE DIFFERENCES TEST PVALUE Y The NORMALIZED form returns the Dixon-Massey transformation of the statistic described above. Note that the CDF and PVALUE are not computed for N < 20 (they will be set to the minimum machine value in this case). Enter HELP STATISTICS for a list of commands that can be used with Dataplot supported statistics. See Program 2 for an example.
The run sequence plot, the lag plot, and the auto-correlation plots can be used to graphically assess whether or not there is trend or auto-correlationin the data. The 4-plot can be used to assess the more general assumption of "independent, identically distributed" data. The Cox Stuart test is a non-parametric test for trend. The Ljung Box test is a test for randomness based on the auto-correlation for a number of lags (i.e., more than first order auto-correlation). The runs test is a test for randomness based on the number of runs. The frequency test, the frequency within a block test, and the cusum test can be used to test the randomness of sequence of zeros and ones.
DURBIN WATSON TEST MEAN SUCCESSIVE DIFFERENCES ADJACENCY RANDOMNESS TEST ADJACENCY RANDOMNESS ADJACENCY TEST ADJACENCY
John V. Neumann (1941), "Distribution of the Ratio of the Mean Successive Difference to the Variance", Annals of Mathematical Statistics, 12, 367-395. Dean Neubauer, "Testing for Randomness: The Mean Successive Differences Test", ASTM Standardization News, September/October 2012, pp. 12-13. Dixon and Massey (1957), "Introduction to Statistical Analysis", McGraw Hill, p. xxx.
2013/1
. Purpose: Mean Successive Difference Test for Randomness
.
. Step 1:  Read the Data
.
.          The ZAR110.DAT file contains the data from the Neubauer
.          article.
.
skip 25
read zarr110.dat y1
read lew.dat     y2
skip 0
.
.          Sample data from example 2 on page 171 of Conover.
.
let y3 = data 45.25 45.83 41.77 36.26 45.37 52.25 35.37 57.16 35.37 ...
              58.32 41.05 33.72 45.73 37.90 41.72 36.07 49.83 36.24 ...
              39.90
.
let y x = stack y1 y2 y3
.
set write decimals 4
mean successive difference test y1 y2 y3
replicated mean successive difference test y x
The following output is generated.
            Mean Successive Differences Test for Randomness

Response Variable: Y1

H0: The Data Are Random
Ha: The Data Are Not Random

Summary Statistics:
Number of Observations:                              25
Sample Mean:                                    80.0855
Sample Standard Deviation:                       1.0472
Sample Minimum:                                 77.0900
Sample Maximum:                                 81.5900

Test Statistic:                                  1.2034
Normalized Test Statistic:                       2.0745
CDF Value:                                       0.9809


            Test Based on Normal Approximation

Conclusions (Two-Tailed Test)
------------------------------------------------------------
                                                        Null
   Significance           Test       Critical     Hypothesis
          Level      Statistic    Value (+/-)     Conclusion
------------------------------------------------------------
          50.0%         2.0745         0.6744         REJECT
          80.0%         2.0745         1.2815         REJECT
          90.0%         2.0745         1.6448         REJECT
          95.0%         2.0745         1.9599         REJECT
          99.0%         2.0745         2.5758         ACCEPT
          99.9%         2.0745         3.2905         ACCEPT


            Mean Successive Differences Test for Randomness

Response Variable: Y2

H0: The Data Are Random
Ha: The Data Are Not Random

Summary Statistics:
Number of Observations:                             200
Sample Mean:                                  -177.4350
Sample Standard Deviation:                     277.3321
Sample Minimum:                               -579.0000
Sample Maximum:                                300.0000

Test Statistic:                                  2.6096
Normalized Test Statistic:                      -4.3324
CDF Value:                                       0.0000


            Test Based on Normal Approximation

Conclusions (Two-Tailed Test)
------------------------------------------------------------
                                                        Null
   Significance           Test       Critical     Hypothesis
          Level      Statistic    Value (+/-)     Conclusion
------------------------------------------------------------
          50.0%        -4.3324         0.6744         REJECT
          80.0%        -4.3324         1.2815         REJECT
          90.0%        -4.3324         1.6448         REJECT
          95.0%        -4.3324         1.9599         REJECT
          99.0%        -4.3324         2.5758         REJECT
          99.9%        -4.3324         3.2905         REJECT


            Mean Successive Differences Test for Randomness

Response Variable: Y3

H0: The Data Are Random
Ha: The Data Are Not Random

Summary Statistics:
Number of Observations:                              19
Sample Mean:                                    42.9005
Sample Standard Deviation:                       7.3697
Sample Minimum:                                 33.7199
Sample Maximum:                                 58.3200

Test Statistic:                                  2.9972
Normalized Test Statistic:                      -2.2944


            Test Based on Tabulated Values

Conclusions (Two-Sided Test)
---------------------------------------------------------------------------
                                        Lower          Upper           Null
   Significance           Test       Critical       Critical     Hypothesis
          Level      Statistic      Value (<)      Value (>)     Conclusion
---------------------------------------------------------------------------
            90%         2.9972         1.4339         2.5659         REJECT
            95%         2.9972         1.2829         2.7170         REJECT
            99%         2.9972         1.0200         2.9800         REJECT


            Mean Successive Differences Test for Randomness

Response Variable: Y
Factor Variable 1: X                             1.0000

H0: The Data Are Random
Ha: The Data Are Not Random

Summary Statistics:
Number of Observations:                              25
Sample Mean:                                    80.0855
Sample Standard Deviation:                       1.0472
Sample Minimum:                                 77.0900
Sample Maximum:                                 81.5900

Test Statistic:                                  1.2034
Normalized Test Statistic:                       2.0745
CDF Value:                                       0.9809


            Test Based on Normal Approximation

Conclusions (Two-Tailed Test)
------------------------------------------------------------
                                                        Null
   Significance           Test       Critical     Hypothesis
          Level      Statistic    Value (+/-)     Conclusion
------------------------------------------------------------
          50.0%         2.0745         0.6744         REJECT
          80.0%         2.0745         1.2815         REJECT
          90.0%         2.0745         1.6448         REJECT
          95.0%         2.0745         1.9599         REJECT
          99.0%         2.0745         2.5758         ACCEPT
          99.9%         2.0745         3.2905         ACCEPT


            Mean Successive Differences Test for Randomness

Response Variable: Y
Factor Variable 1: X                             2.0000

H0: The Data Are Random
Ha: The Data Are Not Random

Summary Statistics:
Number of Observations:                             200
Sample Mean:                                  -177.4350
Sample Standard Deviation:                     277.3321
Sample Minimum:                               -579.0000
Sample Maximum:                                300.0000

Test Statistic:                                  2.6096
Normalized Test Statistic:                      -4.3324
CDF Value:                                       0.0000


            Test Based on Normal Approximation

Conclusions (Two-Tailed Test)
------------------------------------------------------------
                                                        Null
   Significance           Test       Critical     Hypothesis
          Level      Statistic    Value (+/-)     Conclusion
------------------------------------------------------------
          50.0%        -4.3324         0.6744         REJECT
          80.0%        -4.3324         1.2815         REJECT
          90.0%        -4.3324         1.6448         REJECT
          95.0%        -4.3324         1.9599         REJECT
          99.0%        -4.3324         2.5758         REJECT
          99.9%        -4.3324         3.2905         REJECT


            Mean Successive Differences Test for Randomness

Response Variable: Y
Factor Variable 1: X                             3.0000

H0: The Data Are Random
Ha: The Data Are Not Random

Summary Statistics:
Number of Observations:                              19
Sample Mean:                                    42.9005
Sample Standard Deviation:                       7.3697
Sample Minimum:                                 33.7199
Sample Maximum:                                 58.3200

Test Statistic:                                  2.9972
Normalized Test Statistic:                      -2.2944


            Test Based on Tabulated Values

Conclusions (Two-Sided Test)
---------------------------------------------------------------------------
                                        Lower          Upper           Null
   Significance           Test       Critical       Critical     Hypothesis
          Level      Statistic      Value (<)      Value (>)     Conclusion
---------------------------------------------------------------------------
            90%         2.9972         1.4339         2.5659         REJECT
            95%         2.9972         1.2829         2.7170         REJECT
            99%         2.9972         1.0200         2.9800         REJECT
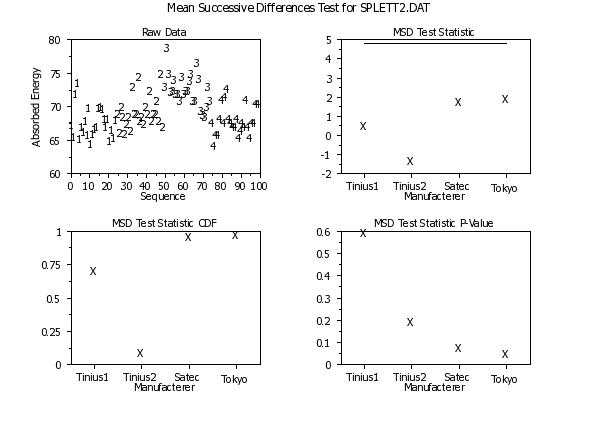
Program 2:
skip 25
read splett2.dat y  x
skip 0
.
title case asis
title offset 2
label case asis
x1label displacement 12
multiplot scale factor 2
multiplot corner coordinates 5 5 95 95
multiplot 2 2
.
let ntemp = size y
let xseq = sequence 1 1 ntemp
char 1 2 3 4
line blank blank blank blank
y1label Absorbed Energy
x1label Sequence
title Raw Data
plot y xseq x
char blank all
line solid all
.
xlimits 1 4
major xtic mark number 4
minor xtic mark number 0
tic mark offset units data
x1tic mark offset 0.5 0.5
tic mark label case asis
x1tic mark label format alpha
x1tic mark label content Tinius1 Tinius2 Satec Tokyo
x1label Manufacterer
.
char X
line blank
y1label
title MSD Test Statistic
mean successive differences test normalized plot y x
title MSD Test Statistic CDF
mean successive differences test cdf plot y x
title MSD Test Statistic P-Value
mean successive differences test pvalue plot y x
.
end of multiplot
.
case asis
justification center
move 50 97
text Mean Successive Differences Test for SPLETT2.DAT
Date created: 02/15/2013 |
Last updated: 12/11/2023 Please email comments on this WWW page to [email protected]. | ||||||||||||||||||||||||||||||||||||||||||||||||||||||||||
 in the
formula above drops out.
in the
formula above drops out.