|
|
KAPLAN MEIER PLOTName:
where T is the lifetime of a randomly selected unit. Given n units, which are ordered from smallest to largest, t1, t2, ... , tn where ti can represent either a failure time or a censoring time (i.e., the unit was removed from the test before failing), then the Kaplan Meier estimates are given by:
where S is the set of all subscripts j such that tj) is a failure time (i.e., S excludes the censoring times). That is, for index i, the product is for all indices less than or equal to i that represent actual failure times. The Kaplan-Meier plot is a plot of \( \hat{R}(t_i) \) versus the failure time. Once \( \hat{R} \) is computed, then the CDF estimates are
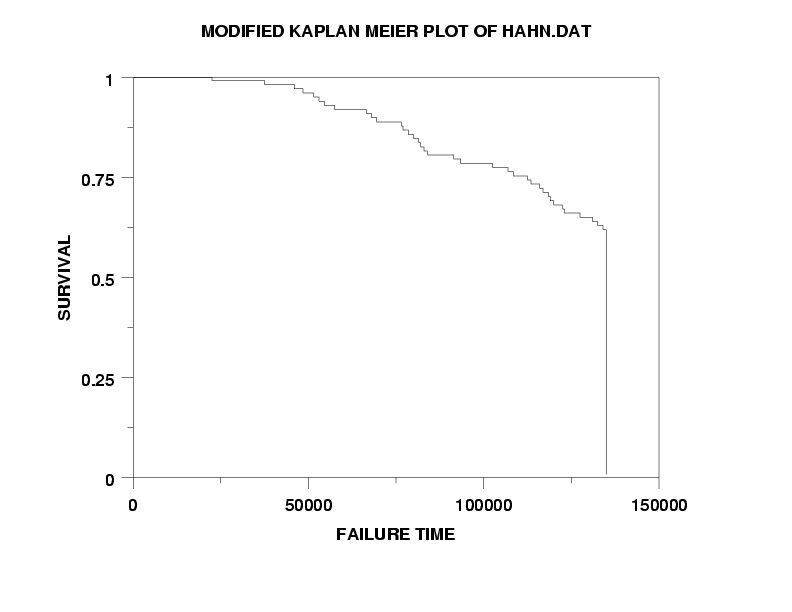
That is, the Kaplan-Meier estimates are a way to estimate the CDF function when you have censored data. The Kaplan-Meier estimate of the last failure time is zero, which results in a CDF value of 1. Since the reliability (= 1 - CDF) for standard reliability models asymptotically approaches 1 as time approaches infinity, a modified Kaplan-Meier estimate has been developed:
Generally, the modified form of the Kaplan-Meier plot is preferred. The Kaplan-Meier plot can be thought of as an alternative to the empirical CDF plot that can handle data with both failure and censoring times. In Dataplot, a tag variable identifies whether the corresponding points in the response variable represent failure times or censoring times. A value of 1 indicates a failure time and a value of 0 indicates a censoring time.
where <y> is a response variable containing failure times; <tag> is a tag variable indicating whether the times in <y> are failure times or censoring times; and where the <SUBSET/EXCEPT/FOR qualification> is optional. This syntax plots the unmodified Kaplan-Meier estimates.
where <y> is a response variable containing failure times; <tag> is a tag variable indicating whether the times in <y> are failure times or censoring times; and where the <SUBSET/EXCEPT/FOR qualification> is optional. This syntax plots the modified Kaplan-Meier estimates.
MODIFIED KAPLAN MEIER PLOT Y1 CENSOR
Enter the following command to plot 1 - Rhat:
Enter the following command to reset the default (plot Rhat):
LET RELI = YPLOT LET FAILTIME = XPLOT The variables RELI and FAILTIME can then be used in subsequent analysis and output.
READ HAHN.DAT MILES TAG TITLE MODIFIED KAPLAN MEIER PLOT OF HAHN.DAT Y1LABEL SURVIVAL X1LABEL FAILURE TIME XLIMITS 0 150000 MODIFIED KAPLAN MEIER PLOT MILES TAG
Date created: 06/05/2001 |
Last updated: 12/04/2023 Please email comments on this WWW page to [email protected]. | ||||||||||||||||||