
|
|
EMBEDName:
The EMBED command provides an alternative method for generating multiplot plots per page. It works as follows:
Although EMBED is similar to MULTIPLOT, there are several important distinctions.
The EMBED command has several typical uses.
where ON starts an embed sequence and OFF ends an embed sequence.
where <x1> is a decimal number or parameter that specifies the horizontal position of the lower left corner; <y1> is a decimal number or parameter that specifies the vertical position of the lower left corner; <x2> is a decimal number or parameter that specifies the horizontal position of the upper right corner; <y2> is a decimal number or parameter that specifies the vertical position of the upper right corner. The values of <x1>, <y1>, <x2>, and <y2> are given in units of the first plot generated after the EMBED ON command (the base coordinate system). If a subsequent plot specifies embed corner coordinates that are outside the range of the base coordinate system, an error will be reported and the plot will not be generated. Note that the corner coordinates given here simply position the plot area. This is independent of the coordinate system for the subsequent plot.
PLOT Y X EMBED CORNER COORDINATES 200 10 350 45 HISTOGRAM Z EMBED OFF
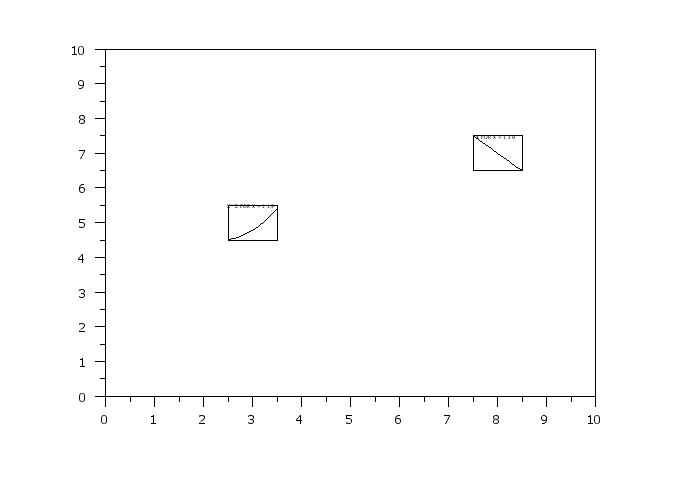
. Step 1:   Define the outer coordinate system
.
limits 0 10
line blank
multiplot scale factor 5
embed on
plot x for x = 1 1 9
.
. Step 2:   Now generate sub-plots
.
.           Note that in this case, the sub-plots
.           are independent of the primary plot
.
frame corner coordinates 0 0 100 100
tic marks off
tic mark labels off
title offset -10
limits
line solid
.
title x**2 for x = 1 1 9
embed corner coordinates 2.5 4.5 3.5 5.5
plot x**2 for x = 1 1 9
.
title -x for x = 1 1 9
embed corner coordinates 7.5 6.5 8.5 7.5
plot -x for x = 1 1 9
.
. Step 3:   Exit embed mode
.
embed off
 Program 2:
. Step 1: Read the data
.
skip 25
read morales2.dat y1 y2 y3 scan set standard
let nset = unique set
let nstan = unique standard
.
. Step 2: Define the outer coordinate system
.
set let cross tabulate collapse
let ymed = cross tabulate median y1 standard set
let x1 = cross tabulate group one standard set
let x2 = cross tabulate group two standard set
let a1 = 0.25 quantile ymed
let a2 = 0.50 quantile ymed
let a3 = 0.75 quantile ymed
let z0 = data a1 a2 a3
region color red yellow cyan blue
.
xlimits 1 nstan
major xtic mark number nstan
minor xtic mark number 0
x1tic mark offset 0.5 0.5
x1label Experiment ID
x1label displacement 5
.
ylimits 1 nset
major ytic mark number nset
minor ytic mark number 0
y1tic mark offset 0.5 0.5
y1label Set ID
y1label displacement 5
.
frame corner coordinates 8 8 95 95
title offset 2
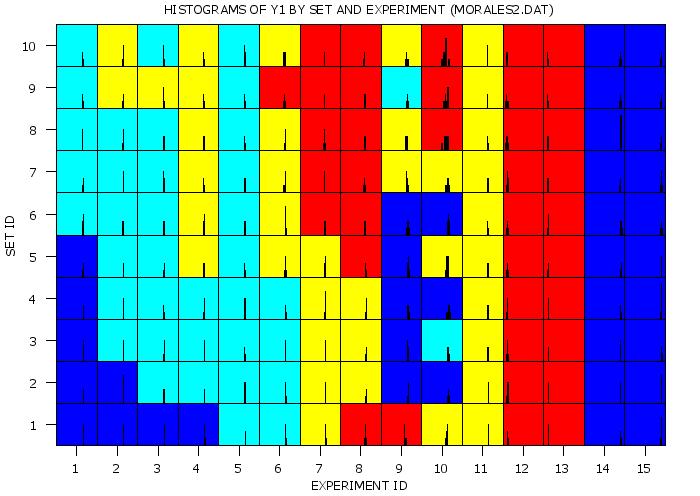
title Histograms of Y1 by Set and Experiment (MORALES2.DAT)
.
line blank
embed on
discrete contour plot y x1 x2 z0
.
title
label
limits
major tic mark number
minor tic mark number
tic mark offset 0 0
.
. Step 3: Now generate sub-plots
.
frame corner coordinates 0 0 100 100
tic marks off
tic mark labels off
line solid
xlimits 21.4 23.4
ylimits 0 6
.
loop for k = 1 1 nstan
let xc1 = k - 0.5
let xc2 = k + 0.5
loop for l = 1 1 nset
let yc1 = l - 0.5
let yc2 = l + 0.5
embed corner coordinates xc1 yc1 xc2 yc2
. kernel density plot y1 subset standard k subset set l
histogram y1 subset standard k subset set l
end of loop
end of loop
.
. Step 4: Exit embed mode and close the plot
.
embed off
|
Privacy
Policy/Security Notice
NIST is an agency of the U.S.
Commerce Department.
Date created: 08/06/2015 | ||||||||