COMOVEMENT PLOT
Name:
Type:
Purpose:
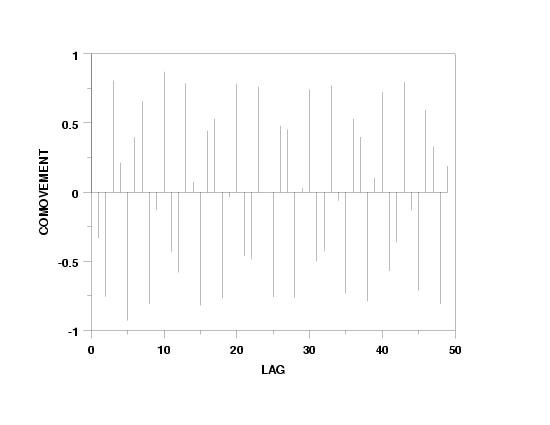
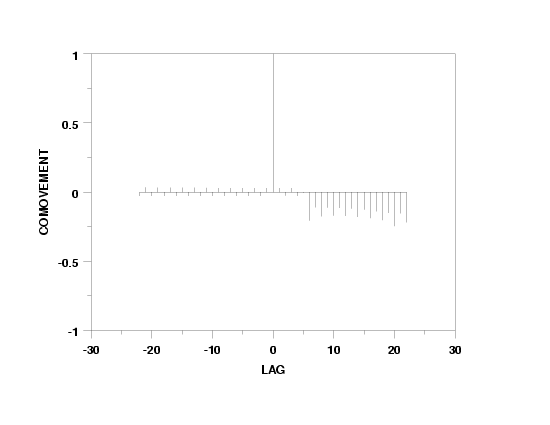
Generates a comovement plot.
Description:
A comovement plot is a graphical data analysis technique for
determining if comovement exists between:
- lags for a single time series (an autocomovement plot);
- lags for two time series (a cross-comovement plot).
The comovement plot consist of:
Vertical axis = comovement coefficient (a value between -1
and 1);
Horizontal axis = lag (an integer between 1 and n/4 where
= number of observations).
The Leigh-Perlman comovement coefficient is the sum of cross
products divided by N-1. The equation for the lag k
comovement coefficient is:
\(
C_k = \frac{\sum_{i=k+1}^{n}{(x_i - x_{i-k})(y_i - y_{i-k})}}
{\sqrt{\sum_{i=k+1}^{n}{(x_i - x_{i-k})^2}\sum_{i=k+1}^{n}{(y_i - y_{i-k})^2}}}
\)
The computed coefficient has a value between -1 and +1.
Syntax 1:
AUTOCOMOVEMENT PLOT <y>
<SUBSET/EXCEPT/FOR qualification>
where <y> is the response variable;
and where the <SUBSET/EXCEPT/FOR qualification> is optional.
Syntax 2:
CROSS-COMOVEMENT PLOT <y1> <y2>
<SUBSET/EXCEPT/FOR qualification>
where <y1> is the first response variable;
<y2> is the second response variable;
and where the <SUBSET/EXCEPT/FOR qualification> is optional.
Examples:
AUTOCOMOVEMENT PLOT Y
CROSS COMOVEMENT PLOT Y1 Y2
Note:
After generating an autocomovement or cross-comovement plot, the
variable YPLOT contains the numerical values for the correlations.
If you need to do additional analysis, or simply wish to print the
numeric values, copy this variable to a user variable (e.g., LET
COMOVE = YPLOT). The YPLOT variable is overwritten when the next
plot is generated.
Note:
The LINE, CHARACTER, SPIKE, and BAR commands can be used to control
the appearance of the comovement plot. For example, some analysts
prefer to draw comovements as spikes from the zero baseline.
Trace 1 is the comovement line and trace 2 is the line at zero.
Note:
The number of lags is determined automatically. If you want to
override the default, enter one of the following commands:
LET LAGS = <value>
LET LAG = <value>
LET NUMLAG = <value>
Default:
Synonyms:
Related Commands:
|
COMOVEMENT
|
= Compute the comovement statistic.
|
|
CORRELATION PLOT
|
= Generates an auto or cross correlation plot.
|
|
SPECTRUM
|
= Generates a spectral plot.
|
|
CHARACTERS
|
= Sets types for plot characters.
|
|
LINES
|
= Sets types for plot lines.
|
|
SPIKES
|
= Sets on/off switches for plot spikes.
|
Reference:
"An Index for Comovement of Time Sequences with Geophysical
Applications: A Working Paper", Penn State Interface Conference on
Astronomy, August, 1991.
Applications:
Implementation Date:
Program 1:
SKIP 25
READ LEW.DAT DEFLECT
.
LINE BLANK SOLID
SPIKE ON
SPIKE BASE 0
XLABEL LAG
Y1LABEL COMOVEMENT
.
AUTOCOMOVEMENT PLOT DEFLECT

Program 2:
SKIP 25
READ HAYES1.DAT Y1 Y2
.
LINE BLANK SOLID
SPIKE ON
SPIKE BASE 0
XLABEL LAG
Y1LABEL COMOVEMENT
.
CROSS-COMOVEMENT PLOT Y1 Y2

Date created: 06/05/2001
Last updated: 12/04/2023
Please email comments on this WWW page to
[email protected].
|
|

