
|
|
4 PLOTName:
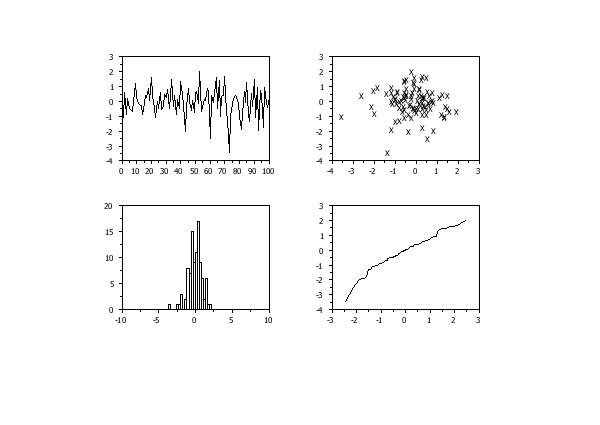
These assumptions are often stated as "indenpendent, identically distributed" (iid) random variables. These assumptions often apply when we have collected a univariate data set. However, it also applies in a modeling context (e.g., linear regression) where the assumptions apply to the residuals of the model rather than to the response variable of the model. The 4-plot is a collection of four specific graphical techniques whose purpose is to test these assumptions. A 4-plot consists of a
If the four underlying assumptions of a typical measurement process hold, then the above four plots will have a characteristic appearance. If any of the underlying assumptions fail to hold, then it will be revealed by an anomalous appearance in one or more of the plots. Specifically, the run sequence plot is a useful graph for assessing the fixed location and variation assumptions. The lag plot should have a random appearance if the randomness assumption holds. The histogram and normal probability plot are used to give some insight into the distribution of the data. In many cases, the distributional assumption is tightened to specify that the data follow an approximately normal distribution.
where <y> is a response variable; and where the <SUBSET/EXCEPT/FOR qualification> is optional.
where <y> is a response variable; <x> is a group-id variable; and where the <SUBSET/EXCEPT/FOR qualification> is optional.
4-PLOT RUN1 4-PLOT Y1 SUBSET TAG = 1
To restore the default of a normal probability plot, enter
If you want the 4-PLOT command to utilize the settings from the MULTIPLOT CORNER COORDINATE command, enter
To restore the default of ignoring the MULTIPLOT CORNER COORDINATE settings, enter
2002/04: Added SET 4PLOT MULTIPLOT 2006/10: Added SET 4PLOT DISTRIBUTION 2011/06: Added HIGHLIGHT option
LET Y1 = NORMAL RANDOM NUMBERS FOR I = 1 1 100
TIC MARK LABEL SIZE 4
CHARACTER SIZE 4
4-PLOT Y1
 Program 2:
SKIP 25
READ LEW.DAT Y
LET N = SIZE Y
LET TAG = 0 FOR I = 1 1 N
LET TAG(3) = 1
LET TAG(5) = 1
LET TAG(157) = 1
LET TAG(158) = 1
.
TITLE AUTOMATIC
TITLE CASE ASIS
TITLE OFFSET 2
TITLE SIZE 4
LABEL CASE ASIS
TIC MARK LABEL SIZE 4
TIC MARK OFFSET UNITS SCREEN
TIC MARK OFFSET 5 5
MULTIPLOT CORNER COORDINATES 5 5 95 95
SET 4PLOT MULTIPLOT ON
.
CHARACTER COLOR BLACK RED
CHARACTER X X
LINE BLANK BLANK
BAR FILL ON ON
BAR FILL COLOR RED BLUE
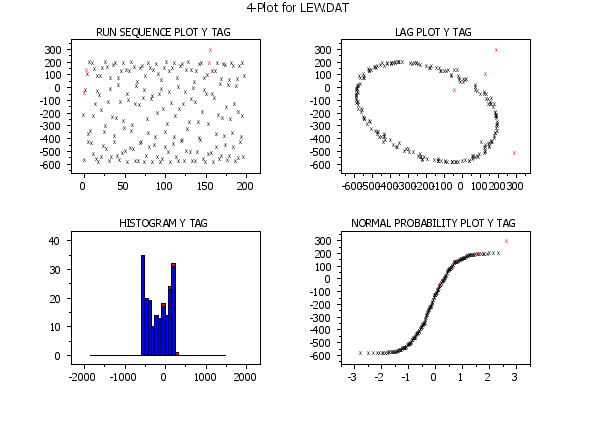
HIGHLIGHT 4-PLOT Y TAG
.
CASE ASIS
JUSTIFICATION CENTER
MOVE 50 97
TEXT 4-Plot for LEW.DAT
 Program 3:
SKIP 25
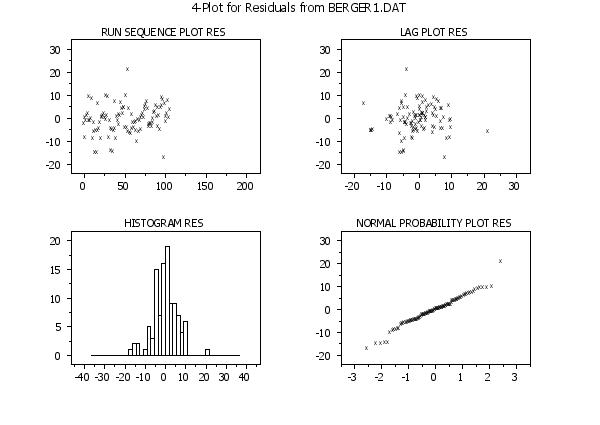
READ BERGER1.DAT Y X
FIT Y X
.
TITLE AUTOMATIC
TITLE CASE ASIS
TITLE OFFSET 2
TITLE SIZE 4
LABEL CASE ASIS
TIC MARK LABEL SIZE 4
TIC MARK OFFSET UNITS SCREEN
TIC MARK OFFSET 5 5
MULTIPLOT CORNER COORDINATES 5 5 95 95
SET 4PLOT MULTIPLOT ON
.
CHARACTER X
LINE BLANK
4-PLOT RES
.
CASE ASIS
JUSTIFICATION CENTER
MOVE 50 97
TEXT 4-Plot for Residuals from BERGER1.DAT
|
Privacy
Policy/Security Notice
NIST is an agency of the U.S.
Commerce Department.
Date created: 06/04/2016 | |||||||||||||||||||||||||