|
|
|
|
Dataplot: Lines
Introduction
|
Dataplot can draw a curve as a character or plot symbol at each
point, as a connected line, as a spike from the point to a base,
as a bar from the point to a base, or as any combination of the
above (including drawing none or all of them). The choice is
determined by the
LINE,
CHARACTER,
SPIKE, and
BAR commands. The switches
for these commands work independently of each other.
|
Available Line Types
|
The following table displays the available line types in
Dataplot. Note that Dataplot generates dash and dot patterns
using the hardware capabilities of the given graphics device.
This means that the actual appearance of a dash pattern
can vary depending on the specific graphics device used.
|
Use of Short Forms
|
The short designations (e.g., BL for BLANK, SO for SOLID, DA3 for
DASH3) allow for the specification of a large number of line
types on a single command line, as in
|
How Dataplot Determines Which Line Setting to Use
|
|
For single-trace plots, as from
PLOT Y X TAG Dataplot makes use of the respective line types for each trace; thus the first line type defines the type for the first trace, the second line type defines the type for the second trace, and so forth.
Sample Dataplot Code
|
In addition to a line style, the color and thickness of lines can
also be set by the user. For example, the following Dataplot code
|
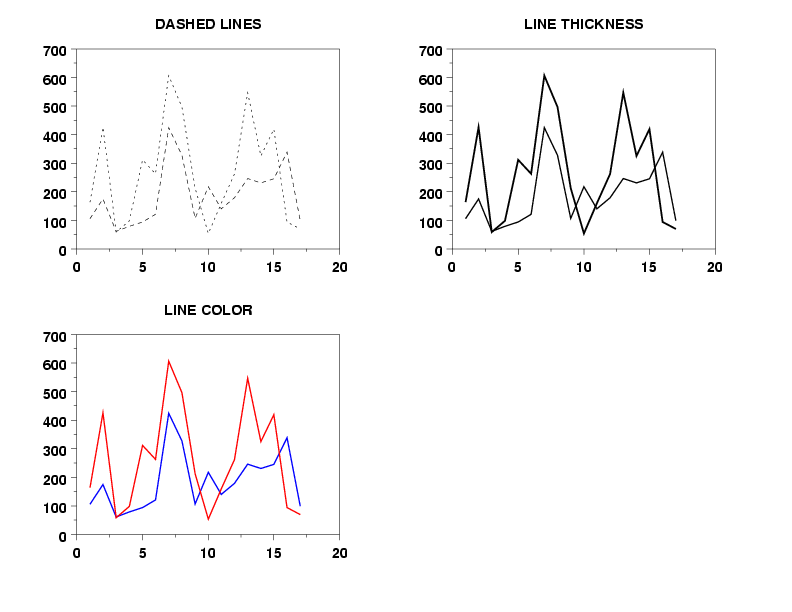
164 426 59 98 312 263 607 497 213 54 160 262 547 325 419 94 70 END OF DATA SERIAL READ POT 106 175 61 79 94 121 424 328 107 218 140 179 246 231 245 339 99 END OF DATA LET N = SIZE LEAD LET X = SEQUENCE 1 1 N . MULTIPLOT 2 2 MULTIPLOT CORNER COORDINATES 0 0 100 100 LINE DASH DOT TITLE DASHED LINES PLOT POT LEAD VS X . LINE SOLID ALL LINE THICKNESS 0.2 0.3 TITLE THICK LINES PLOT POT LEAD VS X . LINE THICKNESS 0.2 ALL LINE COLOR BLUE RED TITLE LINE COLOR PLOT POT LEAD VS X END OF MULTIPLOT
Dataplot Graph
|
generated the following plot.
|
|
Privacy
Policy/Security Notice
NIST is an agency of the U.S.
Commerce Department.
Date created: 06/05/2001 | ||||||||||||||||||