|
- Question:
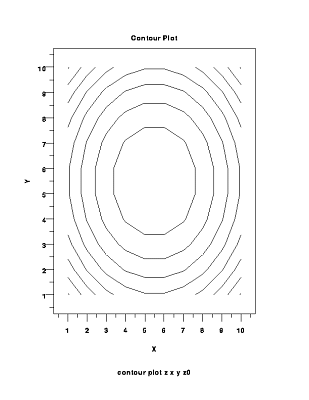
- How does Z change as a function of X and Y
- Definition:
- Vertical Axis: Independent variable 2
- Horizontal Axis: Independent variable 1
- Lines: Iso-response values
- Interpretation/Conclusion:
- The surface is symmetric & peaks in center
- NIST/SEMATECH Handbook Chapter:
- 1.
Exploratory Data Analysis
- 5.
Process Improvement
- Reference:
- xx
|
Dataplot Command: CONTOUR PLOT Z X Y Z0
- Dataplot Code:
- LET X = SEQUENCE 1 1 10 FOR I = 1 1 100
- LET Y = SEQUENCE 1 10 1 10
- LET Z = X**2+Y**2
- LET Z0 = SEQUENCE 0 10 200
- CONTOUR PLOT Z X Y Z0
- Dataplot Reference
Manual Documentation for CONTOUR PLOT
|
Date created: 06/05/2001
Last updated: 02/13/2023
Please email comments on this WWW page to
[email protected].
|

