5.6. Case Studies
5.6.2. Sonoluminescent Light Intensity Case Study
5.6.2.7. |
Important Factors: Half-Normal Probability Plot |

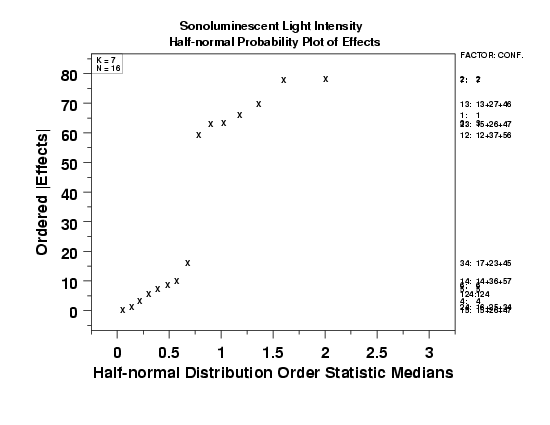
- The points in the plot divide into two clear clusters:
- An upper cluster (|effect| > 60).
- A lower cluster (|effect| < 20).
- The upper cluster contains the effects:
-
X2, X7, X1*X3 (and confounding),
X1, X3, X2*X3 (and confounding),
X1*X2 (and confounding)
These effects should definitely be considered important.
- The remaining effects lie on a line and form a lower cluster.
These effects are declared relatively unimportant.
- The effect id's and the confounding structure are given on the far right (e.g., 13:13+27+46).

