5.6. Case Studies
5.6.2. Sonoluminescent Light Intensity Case Study
5.6.2.4. |
Main and Interaction Effects: Block Plots |
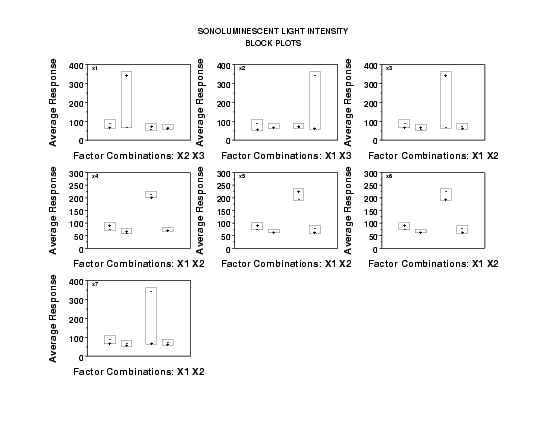
For block plots, it is the height of the bars that is important, not the relative positioning of each bar. Hence we focus on the size and internal signs of the blocks, not "where" the blocks are relative to each other.
We note in passing that for a fractional factorial design, we cannot display all combinations of the six remaining factors. We have arbitrarily chosen two robustness factors, which yields four blocks for comparison.
- Relative Importance of Factors: Because of the expanded vertical axis, due to the two "outliers", the block plot is not particularly revealing. Block plots based on alternatively scaled data (e.g., LOG(Y)) would be more informative.


