5.6. Case Studies
5.6.1. Eddy Current Probe Sensitivity Case Study
5.6.1.4. |
Main and Interaction Effects: Block Plots |
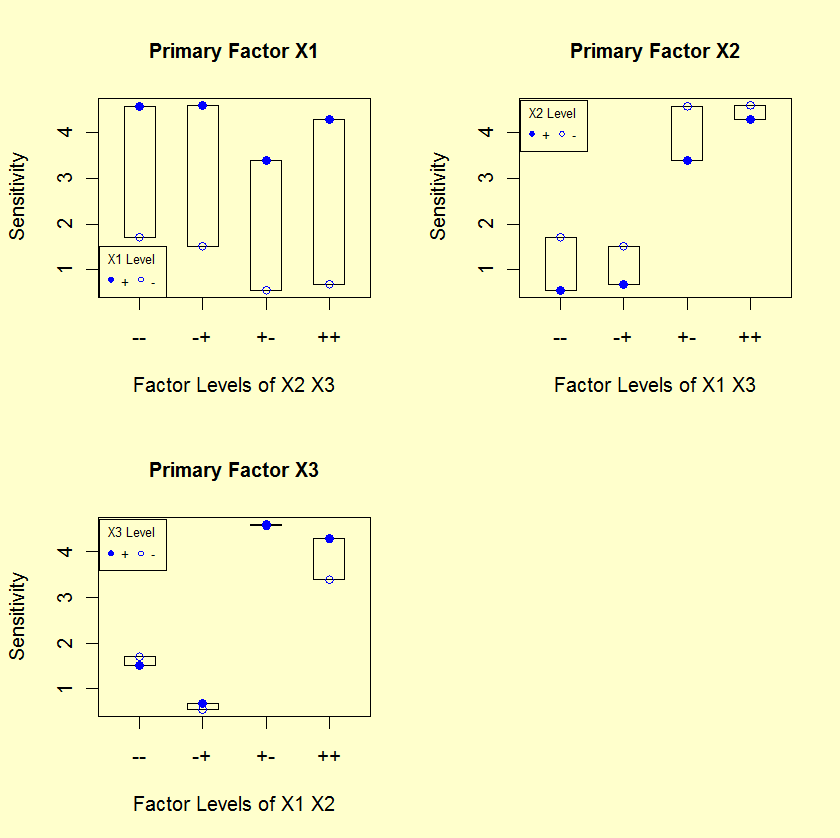
- The first plot below answers the question: Is X1
important? If X1 is important, is this importance
robust over all four settings of X2 and X3?
- The second plot below answers the question: Is X2
important? If X2 is important, is this importance
robust over all four settings of X1 and X3?
- The third plot below answers the question: Is X3 important? If X3 is important, is this importance robust over all four settings of X1 and X2?
- Relative Importance of Factors: All of the bar heights in plot 1
(turns) are greater than the bar heights in plots 2 and 3.
Hence, X1 is more important than X2 and X3.
- Statistical Significance: In plot 1, looking at the levels
within each bar, we note that the response for level 2 is
higher than level 1 in each of the four bars. By chance,
this happens with probability 1/(24) = 1/16 = 6.25 %.
Hence, X1 is near-statistically significant at the 5 % level.
Similarly, for plot 2, level 1 is greater than level 2 for
all four bars. Hence, X2 is near-statistically significant.
For X3, there is no consistent ordering within all
four bars, and hence X3 is not statistically significant.
Rigorously speaking then, X1 and X2 are not statistically
significant (since 6.25 % is not < 5 %); on the other hand such
near-significance is suggestive to the analyst that such factors
may in fact be important, and hence warrant further attention.
Note that the usual method for determining statistical significance is to perform an analysis of variance (ANOVA). ANOVA is based on normality assumptions. If these normality assumptions are valid, then ANOVA methods are the most powerful method for determining statistical signficance. The advantage of the block-plot method is that it is based on less rigorous assumptions than ANOVA. At an exploratory stage, it is useful to know that our conclusions regarding important factors are valid under a wide range of assumptions.
- Interactions: For X1, the four bars do not change height in any systematic way and hence there is no evidence of X1 interacting with either X2 or X3. Similarly, there is no evidence of interactions for X2.


