5.5. Advanced topics
5.5.9. An EDA approach to experimental design
5.5.9.1. |
Ordered data plot |
- What is the best setting (based on the data) for each of the k factors?
- What is the most important factor?
Settings may be declared as "best" in three different ways:
- "best" with respect to the data;
- "best" on average;
- "best" with respect to predicted values from an adequate model.
The ordered data plot will yield best settings based on the first criteria (data). That is, this technique yields those settings that correspond to the best response value, with the best value dependent upon the project goals:
- maximization of the response;
- minimization of the response;
- hitting a target for the response.
- maximization: the observed maximum data point;
- minimization: the observed minimum data point;
- target: the observed data value closest to the specified target.
- Primary: Best setting for each of the k factors.
- Secondary: The name of the most important factor.
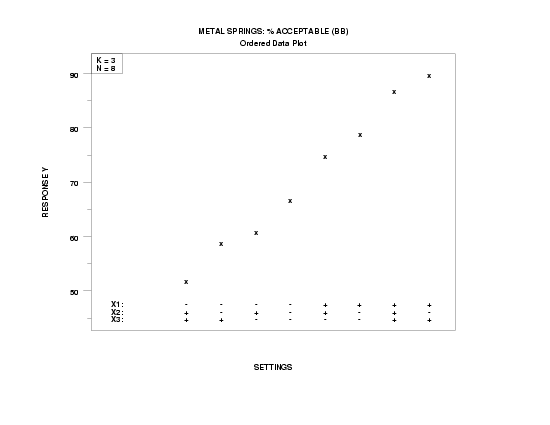
- Vertical Axis: The ordered (smallest to largest) raw response value for each of the n runs in the experiment.
- Horizontal Axis: The corresponding dummy run index (1 to n) with (at each run) a designation of the corresponding settings (- or +) for each of the k factors.
- best settings;
- most important factor.
Best Settings (Based on the Data):
At the best (highest or lowest or target) response value, what are the corresponding settings for each of the k factors? This defines the best setting based on the raw data.
Most Important Factor:
For the best response point and for the nearby neighborhood of near-best response points, which (if any) of the k factors has consistent settings? That is, for the subset of response values that is best or near-best, do all of these values emanate from an identical level of some factor?
Alternatively, for the best half of the data, does this half happen to result from some factor with a common setting? If yes, then the factor that displays such consistency is an excellent candidate for being declared the "most important factor". For a balanced experimental design, when all of the best/near-best response values come from one setting, it follows that all of the worst/near-worst response values will come from the other setting of that factor. Hence that factor becomes "most important".
At the bottom of the plot, step though each of the k factors and determine which factor, if any, exhibits such behavior. This defines the "most important" factor.
- Best Settings (Based on the Data):
(X1, X2, X3) = (+, -, +) = (+1, -1, +1) is the best setting since
- the project goal is maximization of the percent acceptable springs;
- Y = 90 is the largest observed response value; and
- (X1, X2, X3) = (+, -, +) at Y = 90.
- Most important factor:
X1 is the most important factor since the four largest response values (90, 87, 79, and 75) have factor X1 at +1, and the four smallest response values (52, 59, 61, and 67) have factor X1 at -1.


