4.6. Case Studies in Process Modeling
4.6.4. Thermal Expansion of Copper Case Study
4.6.4.3. |
Initial Plot of Data |
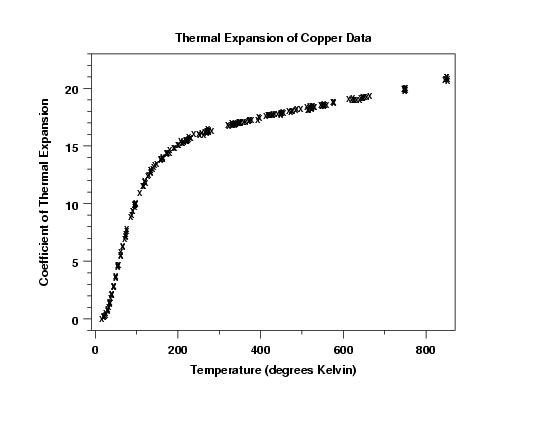
This plot initially shows a fairly steep slope that levels off to a more gradual slope. This type of curve can often be modeled with a rational function model.
The plot also indicates that there do not appear to be any outliers in this data.


