4.6. Case Studies in Process Modeling
4.6.1. Load Cell Calibration
4.6.1.6. |
Model Refinement |

|
4.
Process Modeling
4.6. Case Studies in Process Modeling 4.6.1. Load Cell Calibration
|
|||
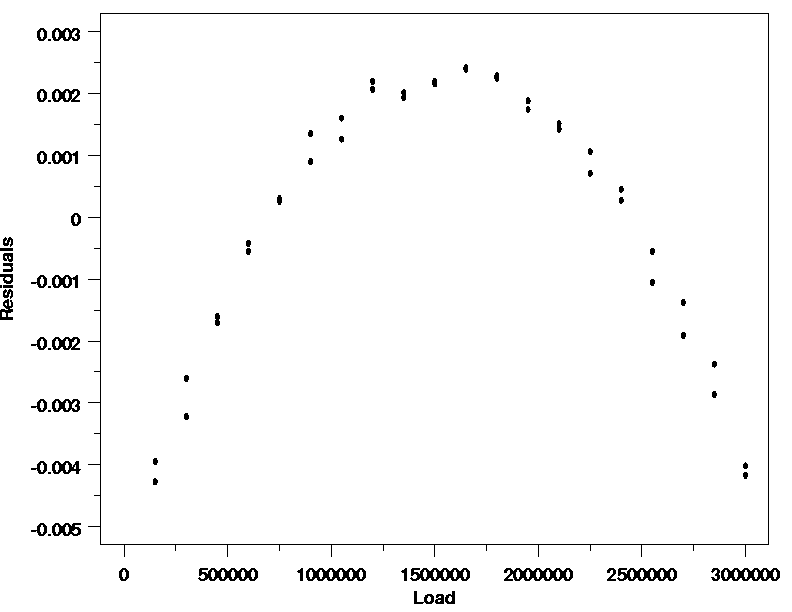
| After ruling out the straight line model for these data, the next task is to decide what function would better describe the systematic variation in the data. | |||
| Reviewing the plots of the residuals versus all potential predictor variables can offer insight into selection of a new model, just as a plot of the data can aid in selection of an initial model. Iterating through a series of models selected in this way will often lead to a function that describes the data well. | |||
| Residual Structure Indicates Quadratic |
|
||
| The horseshoe-shaped structure in the plot of the residuals versus load suggests that a quadratic polynomial might fit the data well. Since that is also the simplest polynomial model, after a straight line, it is the next function to consider. | |||
