6.
Process or Product Monitoring and Control
6.5. Tutorials 6.5.4. Elements of Multivariate Analysis
|
|||
Continuation of example started on the previous page | STEP 6. Plot the T 2 's against the sample numbers and include the UCL. | ||
Mean and dispersion T 2 control charts |
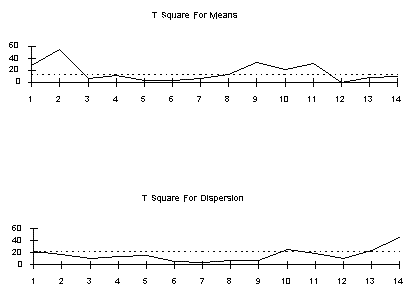
The following figure displays the resulting multivariate control
charts.
![]() |
||
Interpretation of control charts |
Inspection of this figure suggests an out-of-control conditions at
sample numbers 1, 2, 9, 10, and 11 since these points exceed the
T-square for means UCL of 14.52. Fortunately, the process was
apparently back in control after the periods 9-12.
The problem may be caused by one or more univariates, and it could be easier to remedy than when the covariance plays a role in the creation of the undesired situation. To study the cause or causes of the problem one should also contemplate the individual univariate control charts.� |