2.6. Case studies
2.6.5. Uncertainty analysis for extinguishing fire
2.6.5.2. Create a calibration curve for the rotameter/a>
2.6.5.2.1. |
Weighted fit |

 are the variances from each set of replicates in
the data. We then calculate the weights as

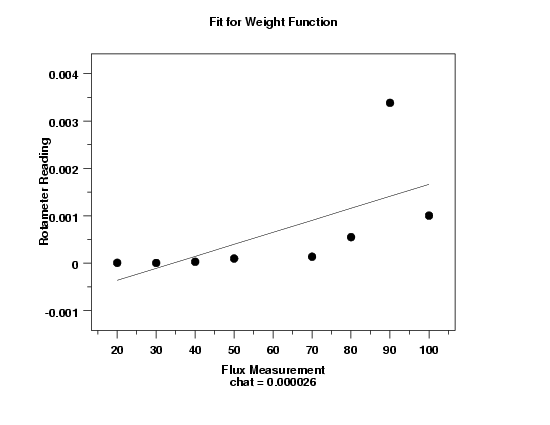
Note that for this data, the plot is dominated by the flux=90 group. Also, the plot does not demonstrate a clear linear pattern. Instead, the variances are basically flat for the first five values, and then there is a rise for the last three values. Based on this plot, it is reasonable to conclude that weighting the fit with this method may do more harm than good.


